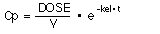
 (Equation 18) and solving for Cp.
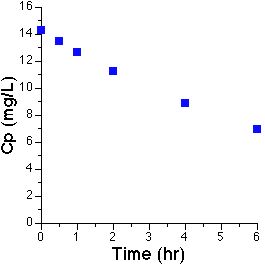
| Time (hr) | Cp (mg/L) |
| 0 | 14.29 |
| 0.5 | 13.45 |
| 1 | 12.67 |
| 2 | 11.24 |
| 4 | 8.84 |
| 6 | 6.95 |
Linear Plot
Not a very good example - notice that there is slight curvature of the line through the data points
Semi-log Plot
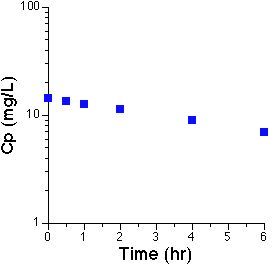
This should be a straight line