Through the data means drawing the line so there are as many points above the line as below it. A visual averaging. A best-fit line. Don't pick two data points and draw the line through them. Draw the line through all the data points. An average fit.
Semi-log Plot
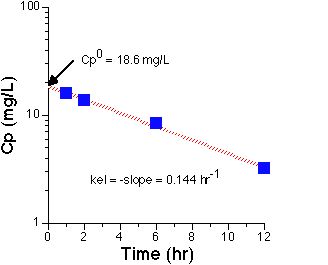
From this plot we can estimate Cp0 from the intercept. Thus, Cp0 = 18.6 mg/L. From the slope of the line kel = 0.144 hr-1.
Since Dose = 300 mg and Cp0 = Dose/V then V = Dose/Cp0 = 300/18.6 L = 16.1 L.
t1/2 = ln2/kel = 0.693/0.144 = 4.81 hr
For the AUC caclulation we need the time values, Cp values and the estimate of Cp0 and kel. Note last AUC segment is Cplast/kel.
| Time (hr) | Cp (mg/L) | AUC (mg.hr/L) | |
| 0 | 18.6 | - | 0 |
| 1 | 15.7 | 17.1 | 17.1 |
| 2 | 13.8 | 14.8 | 31.9 |
| 6 | 8.3 | 44.2 | 76.1 |
| 12 | 3.2 | 34.5 | 110.9 |
| - | 22.2 | 132.8 |
| Parameter | Value | Units |
| kel | 0.144 | hr-1 |
| Cp0 | 18.6 | mg/L |
| V | 16.1 | L |
| t1/2 | 4.81 | hr |
| AUC | 132.8 | mg.hr/L |