| Time Interval (hr) | Volume of Urine Excreted (ml) | Concentration in Urine (µg/ml) | <------> | <------> | <------> |
| 0-1 | 65 | 480 | |||
| 1-2 | 64 | 390 | |||
| 2-4 | 121 | 315 | |||
| 4-6 | 130 | 205 | |||
| 6-9 | no sample | ||||
| 9-12 | 175 | 75 | |||
| 12-24 | 750 | 25 |
NOTE: Missing data means that the Amount Remaining to be Excreted method cannot be used. Thus, need to plot R/E versus midpoint time
| Time Interval(hr) | Volume of Urine Collected (ml) | Concentration in Urine (µg/ml) | tmidpoint (hr) | ||
| 0-1 | 65 | 480 | 31.2 | 0.5 | 31.2 |
| 1-2 | 64 | 390 | 25.0 | 1.5 | 25.0 |
| 2-4 | 121 | 315 | 38.1 | 3 | 19.1 |
| 4-6 | 130 | 205 | 26.7 | 5 | 13.3 |
| 6-9 | no sample | ||||
| 9-12 | 175 | 75 | 13.1 | 10.5 | 3.5 |
| 12-24 | 750 | 25 | 18.8 | 18 | 1.5 |
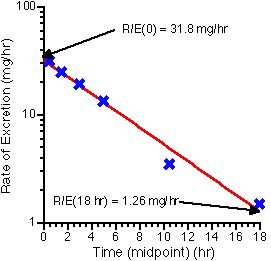
kel from the -ve slope of ln-linear line through the data. Note the R/E on the line at 18 hours is 1.26. NOTE:: This value and the value for R/E will depend on where you put the line. Everyone may put the line in a different place.
kel = (ln 31.8-ln 1.26)/18 = 0.179 hr-1
Since the Intercept = ke x Dose = 31.8 = ke x 400
ke = 31.8/400 = 0.080 hr-1
Since km = kel - ke = 0.179 - 0.080 = 0.099 hr-1
fe = ke/kel = 0.080/0.179 = 0.447
fm = km/kel = 0.099/0.179 = 0.553
| Parameter | Value | Unit |
| kel | 0.179 | hr-1 |
| ke | 0.099 | hr-1 |
| km | 0.099 | hr-1 |
| fe | 0.447 | |
| fm | 0.553 |