| Time Interval(hr) | Volume of Urine Collected (ml) | Concentration in Urine (µg/ml) | <----------------> | <----------------> | <----------------> |
| 0-2 | 120 | 320 | |||
| 2-4 | 130 | 210 | |||
| 4-6 | 125 | 170 | |||
| 6-9 | no sample | ||||
| 9-12 | 200 | 45 | |||
| 12-15 | 190 | 30 |
| Time Interval(hr) | Volume of Urine Collected (ml) | Concentration in Urine (µg/ml) | tmidpoint (hr) | ||
| 0-2 | 120 | 320 | 38.4 | 1 | 19.2 |
| 2-4 | 130 | 210 | 27.3 | 3 | 13.65 |
| 4-6 | 125 | 170 | 21.75 | 5 | 10.63 |
| 6-9 | no sample | ||||
| 9-12 | 200 | 45 | 9 | 10.5 | 3 |
| 12-15 | 190 | 30 | 5.7 | 13.5 | 1.9 |
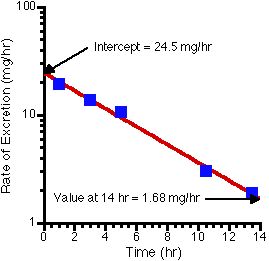
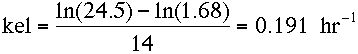
kel from the -ve slope of ln-linear line through the data. Note the R/E on the line at 14 hours is 1.68. NOTE:: This value and the value for R/E will depend on where you put the line. Everyone may put the line in a different place.
Since the Intercept = ke x Dose = 24.5 = ke x 500
ke = 24.5/500 = 0.049 hr-1
Since km = kel - ke = 0.191 - 0.049 = 0.142 hr-1
fe = ke/kel = 0.049/0.191 = 0.257
fm = km/kel = 0.142/0.191 = 0.743
| Parameter | Value | Unit |
| kel | 0.191 | hr-1 |
| ke | 0.049 | hr-1 |
| km | 0.142 | hr-1 |
| fe | 0.257 | |
| fm | 0.743 |