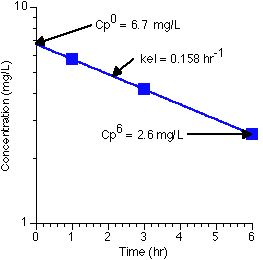
With the Cp0 = 6.7 mg/L and Cp6hr (from the line) = 2.6 mg/L the elimination rate constant can be calculated as 0.158 hr-1 and the volume of distribution as 14.9 L.
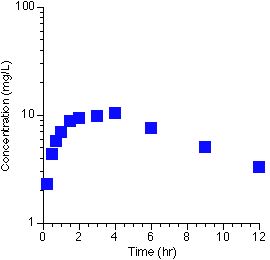
Plotting the oral data on semi-log paper gives:
Using the Method of Residual The Calculations
| Time (hr) | Cp (mg/L) | Cp late (mg/L) | Residual (mg/L) |
| 0 | 0 | ||
| 0.25 | 2.28 | 17.3 | 15.0 |
| 0.5 | 4.33 | 16.7 | 12.4 |
| 0.75 | 5.67 | 16.1 | 10.4 |
| 1 | 6.89 | 15.6 | 8.7 |
| 1.5 | 8.81 | 14.5 | 5.7 |
| 2 | 9.31 | 13.5 | 4.2 |
| 3 | 9.68 | 11.7 | 2.0 |
| 4 | 10.25 | 10.1 | |
| 6 | 7.51 | 7.6 | |
| 9 | 4.98 | 5.0 | |
| 12 | 3.25 | 3.2 |
Graphing this data with Cplate (green) and Residual (red) lines gives:
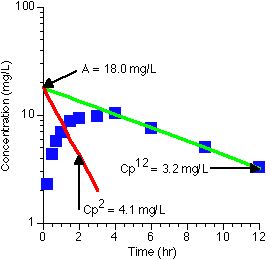
From the two lines kel = 0.144 hr-1 and ka = 0.740 hr-1 (assuming ka > kel)
Thus ka/kel = 5.14 and the method of residuals can be used.
The intercept 'A' value of 18 mg/L can be used to calculate V/F by rearranging equation 52:

V/F = Dose * ka / (A * (ka-kel)) = 300 x 0.740 / (18 x (0.740 - 0.144)) = 20.7 L
Since V = 14.9 L a value for F can be calculated as V/(V/F) = 14.9/20.7 = 0.720
| Parameter | Value | Units |
| kel (I.V.) | 0.158 | hr-1 |
| V (I.V.) | 14.9 | L |
| kel (p.o.) | 0.144 | hr-1 |
| ka (p.o.) | 0.740 | hr-1 |
| F | 0.720 |
Another Approach
Using the Wagner-Nelson method gave a ka value of 0.68 hr-1
The AUC(i.v.) was 42.1 mg.hr/L and the AUC(p.o.) was 100.9 mg.hr/L thus F = 0.80 after adjusting for dose.