


 Equation
 ,
during the dosing interval at steady state.
,
during the dosing interval at steady state.
This term is defined as the area under the plasma concentration versus time curve during the dosing interval at steady state divided by the dosing interval.
Thus:-
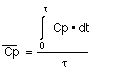
Equation XV-9 Average Cp for a Dosing Interval at Steady State
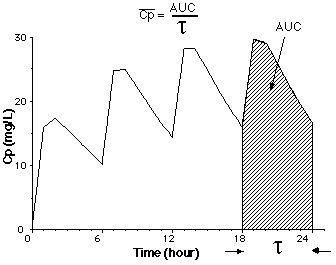
Figure XV-3, Plot of Cp versus Time after Multiple Oral Administration showing AUC at Steady State
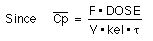
By integrating the equation for plasma concentration at the plateau, between t = 0 and t = t gives:-
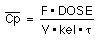
Equation XV-10 Average Cp for a Dosing Interval at Steady State
An interesting result of this equation is that we get the same average plasma concentration whether the dose is given as a single dose every t dosing interval or is subdivided into shorter dosing intervals.
For example 300 mg every 12 hours will give the same average plasma concentration as 100 mg every 4 hours. Of course, the difference between the maximum and minimum plasma concentration will be larger in the case of the less frequent dosing.
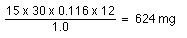
For example F = 1.0; V = 30 liter; t1/2 = 6 hours or kel = 0.693/6 = 0.116 hr-1.
We can now calculate the dose given every 12 hours required to achieve an average plasma concentration of 15 mg/L.
 =
=
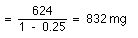
We could now calculate the loading dose
R = e-kel * [[tau]] = e-0.116 x 12 = 0.25

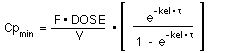
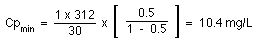
To get some idea of the fluctuations in plasma concentration we could calculate the Cpmin value.
Assuming that ka >> kel and that e-ka * t --> 0, using Equation XV-8.
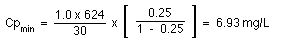
Therefore the plasma concentration would probably fluctuate between 7 and 23 mg/L (very approximate) with an average concentration of about 15 mg/L. [23 = 15 + (15-7), i.e. high = average + (average - low), very approximate!].
As an alternative we could give half the dose, 312 mg, every 6 hours give:-

The  would be the same
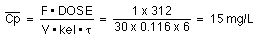
Thus the plasma concentration would fluctuate between about 10.4 to 20 with an average of 15 mg/L.
Copyright 2001 David W.A. Bourne