Homework 1995/01 - #5 Answers
Problem 1
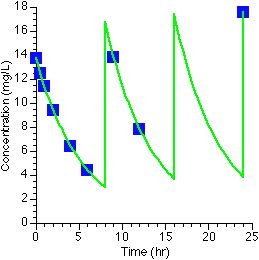
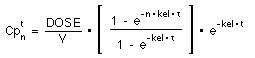
Answer by putting values into
(Equation 62)
Results in Tabular Form
Time(hr)
Number of Doses
Time since Last Dose
Cp (mg/L)
0
1
0
13.74
0.5
1
0.5
12.49
1
1
1
11.36
2
1
2
9.39
4
1
4
6.42
6
1
6
4.39
9
2
1
13.84
12
2
4
7.83
24
4
0
17.54
Linear Plot
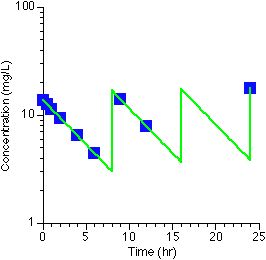
Semi-log Plot
 (Equation 62)