![]()
![]()
![]()
![]()
![]()
One approach is to use the population values for phenytoin. With
this method we would use the population values of Vm = 7 mg/kg/day
and Km = 5 mg/L. Aiming at 15 mg/L for ![]() with a patient weight of 80 kg, the
equation
with a patient weight of 80 kg, the
equation
![]()
Equation XX-3 Dosing Rate versus Average Cp>
![]()
Probably better to start out low since toxicity is more probable above 20 mg/L.
That is after giving a continuous dose regimen to steady state,
measure plasma concentration and adjust dose. For example if after
420 mg/day, ![]() is 20 mg/L then a downward adjustment would be necessary. If we
assume that the Km is close to the average value of 5 mg/L we can
estimate Vm from the equation above
is 20 mg/L then a downward adjustment would be necessary. If we
assume that the Km is close to the average value of 5 mg/L we can
estimate Vm from the equation above
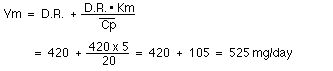
thus a new dose rate can be calculated
![]()
approximately 400 mg/day. Note: A reduction in dose of 20
mg/day (5 %) is calculated to give a 5 mg/L change (25 %) in ![]() . Another approach
can be describe using the 'graph' (nomogram) shown below.
. Another approach
can be describe using the 'graph' (nomogram) shown below.
In Figure XX-6, Line A represents Cpss = 8 mg/L on 300 mg/day (70 kg = 4.3 mg/kg/day). Line B was drawn to achieve a new Cpss = 15 mg/L with a dose of 5.2 mg/kg/day (= 364 mg/day)
The graph is used by plotting the line described by the current Cpss and R on the graph, marking a point in the middle of the contour. From that point draw a line to the desired Cpss, the value on the vertical axis gives the required dose rate, R.

Figure 93, Nomogram for Phenytoin Dosing[3]
If we already have two plasma concentrations after two dose rates we can solve the equation
![]()
using simultaneous equations.
With ![]() = 8.0
mg/L and
= 8.0
mg/L and ![]() =
27.0 mg/L for R1 = 225 mg/day and R2 = 300 mg/day
=
27.0 mg/L for R1 = 225 mg/day and R2 = 300 mg/day
![]()
225 * Km + 225 * 8 = 8 * Vm (1)
and
300 * Km + 300 * 27 = 27 * Vm (2)
or multiplying (1) x 300
300 * 225 * Km + 300 * 225 * 8 = 300 * 8 * Vm (3)
and multiplying (2) x 225
300 * 225 * Km + 300 * 225 * 27 = 225 * 27 * Vm (4)
subtracting (4) - (3)
300 * 225 * (27 - 8) = (225 * 27 - 300 * 8) * Vm
![]()
and
![]()
With these Vm and Km values we can now calculate the next dosing regimen to try.
There are a number of graphical methods which have been described for when you have data from more than two dosing intervals. Basically these rely on converting the equations mentioned above into a straight line form which can be plotted to give the Vm and Km as a function of the intercept and/or slope.
Want more practice with this type of problem!
Copyright 2001 David W.A. Bourne