|
Time (hr) |
Cp (mg/L) |
|
0.125 |
14.00 |
|
0.25 |
11.50 |
|
0.5 |
8.42 |
|
0.75 |
6.81 |
|
1 |
5.95 |
|
1.5 |
5.19 |
|
2 |
4.88 |
|
3 |
4.53 |
|
4 |
4.23 |
|
6 |
3.71 |
|
9 |
3.05 |
|
12 |
2.50 |
|
18 |
1.68 |
|
24 |
1.13 |
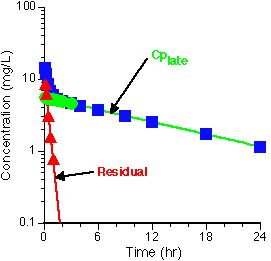
The green line and symbols represent the
Cplate
line. A value for ![]() can be calculated
from this line to be
0.0662 hr-1 with the intercept value, B = 5.53 mg/L.
The table below can be completed with the calculation of the residual
(= Cp - Cplate). Plotting the
Residual versus time gives the
red line on the graph above. From this line it is possible to
calculate
can be calculated
from this line to be
0.0662 hr-1 with the intercept value, B = 5.53 mg/L.
The table below can be completed with the calculation of the residual
(= Cp - Cplate). Plotting the
Residual versus time gives the
red line on the graph above. From this line it is possible to
calculate ![]() = 2.74 hr-1
(from the slope) and A = 12.0 mg/L (from the intercept)
= 2.74 hr-1
(from the slope) and A = 12.0 mg/L (from the intercept)
|
Time (hr) |
Cp (mg/L) |
Cplate (mg/L) |
Time (hr) |
Residual (mg/L) |
|
0.125 |
14 |
5.49 |
0.125 |
8.51 |
|
0.25 |
11.5 |
5.44 |
0.25 |
6.06 |
|
0.5 |
8.42 |
5.35 |
0.5 |
3.07 |
|
0.75 |
6.81 |
5.27 |
0.75 |
1.54 |
|
1 |
5.95 |
5.18 |
1 |
0.77 |
|
1.5 |
5.19 |
5.01 |
|
|
|
2 |
4.88 |
4.85 |
|
|
|
3 |
4.53 |
4.54 |
|
|
|
4 |
4.23 |
|
|
|
|
6 |
3.71 |
|
|
|
|
9 |
3.05 |
|
|
|
|
12 |
2.5 |
|
|
|
|
18 |
1.68 |
|
|
|
|
24 |
1.13 |
|
|
|
| Parameter | Value | Units |
| 2.74 | hr-1 | |
| 0.0662 | hr-1 | |
| A | 12.0 | mg/L |
| B | 5.53 | mg/L |
![]() = 0.910 hr-1
= 0.910 hr-1
![]() = 0.200 hr-1
= 0.200 hr-1
![]() = 1.70 hr-1
= 1.70 hr-1
![]() = 17.1 L
= 17.1 L
![]() = 51.5 L
= 51.5 L