|
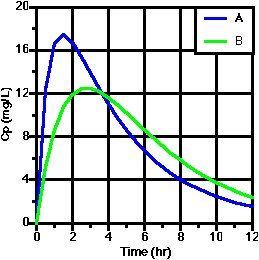
Q 1.1 Version A, D. A linear plot of Cp versus time for two drug products, A and B, given to the same subject. The extent of absorption is the same but product A has a faster absorption rate. |
|
|
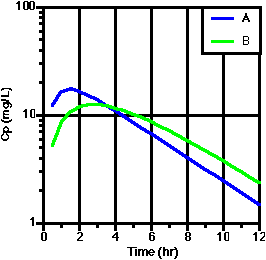
Q 1.1 Version B. Q 1.2 Version C. A semi-log plot of Cp versus time for two drug products, A and B, given to the same subject. The extent of absorption is the same but product A has a faster absorption rate. |
|
|
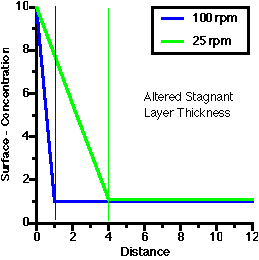
Q 1.2 Version A, B. Q 1.1 Version C. Q 1.3 Version D. Two lines illustrating drug concentration versus distance from the solid drug surface. For one line the agitation is 25 rpm and for the other 100 rpm. Label each line. |
|
|
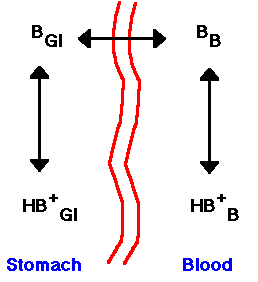
Q 1.3 Version A, B. Q 1.4 Version C. Q 1.2 Version D. A diagram illustrating the species involved in the passive transfer of a weakly basic drug between the stomach and the blood stream. |
|
|
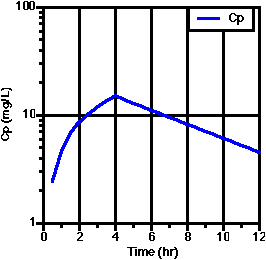
Q 1.4 Version A, D. A semi-log plot of Cp versus time after an IV infusion of 4 hours, show Cp vs. t for 12 hours. |
|
|
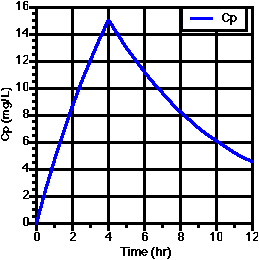
Q 1.4 Version B. Q 1.3 Version C. A linear plot of Cp versus time after an IV infusion of 4 hours, show Cp vs. t for 12 hours. |
|