|
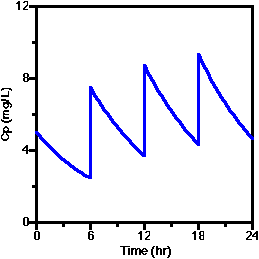
Q 1.1 Version A. A linear plot of Cp versus time after four equal multiple IV bolus doses given at intervals equal to the drug elimination half-life. |
|
|
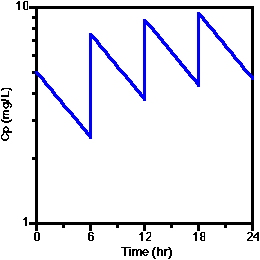
Q 1.1 Version B, D. A semi-log plot of Cp versus time after four equal multiple IV bolus doses given at intervals equal to the drug elimination half-life. |
|
|
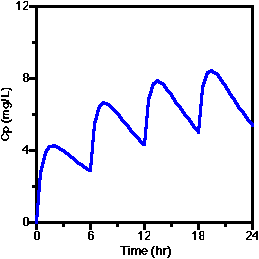
Q 1.1 Version C. A linear plot of Cp versus time after four equal multiple oral doses given at intervals equal to the drug elimination half-life. |
|
|
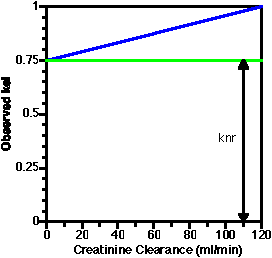
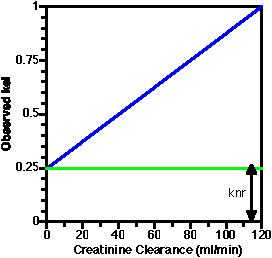
Q1.2 Version A. A Dettli plot for a drug with fe = 0.25. |
|
|
Q1.2 Version B. A Dettli plot for a drug with fe = 0.75. |
|
|
Q1.2 Version C. A Dettli plot for a drug with fe = 0.0. |
|
|
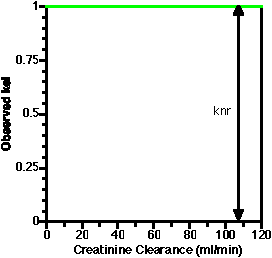
Q1.2 Version D. A Dettli plot for a drug with fe = 1.0. |
|
|
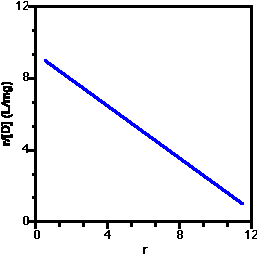
Q1.3 Version A, C, D. A Scatchard plot representing 1:1 drug protein binding with one type of binding site. |
|
|
Q1.3 Version B. Q1.4 Version D. Draw a diagram representing enterohepatic recycling and label three components.. |
|
|
Q1.4 Version A, D. Q1.5 Version B. Sketch a nephron and label three components |
|
|
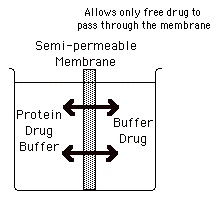
Q1.4 Version B. Sketch an equilbrium dialysis experiment for protein binding determination and label the components. |
|
|
Q1.4 Version C. Sketch an ultrafiltration experiment for protein binding determination and label the components. |
|
|
Q1.5 Version A, C. Sketch a linear plot of Cp versus time after a single oral dose illustrating enterohepatic recycling. |
|
