Question 1
Given the data in Table 1 and 2, calculate ka, F, kel, and V using graph paper and calculator. Assume a one compartment linear model.
|
|
|
|
|
|
|
|
|
|
|
|
|
|
|
|
|
|
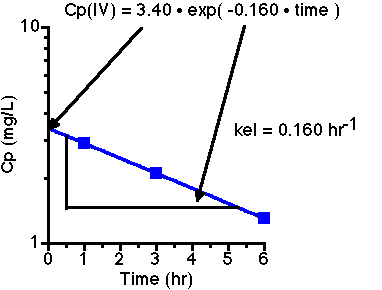
First plot the IV data to get:

From the slope we can calculate kel = 0.160 hr-1. The intercept is 3.40 and the dose is 200 mg, thus V = Dose/Cp(0) = 200/3.40 = 58.8 L.
|
Time (hr) |
Cp (mg/L) |
|
0 |
|
|
0.25 |
0.6 |
|
0.5 |
1.1 |
|
0.75 |
1.5 |
|
1 |
1.9 |
|
1.5 |
2.5 |
|
2 |
2.8 |
|
3 |
3.2 |
|
4 |
3.2 |
|
6 |
2.8 |
|
9 |
1.9 |
|
12 |
1.3 |
|
° |
|
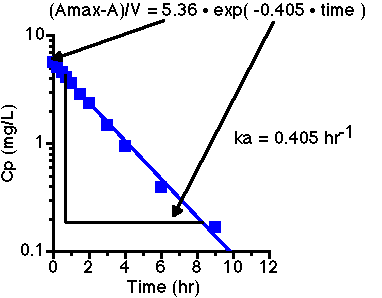
Since we have a kel value from the IV data we can use the Wagner-Nelson method. This involves calculating A/V = Cp + kel • AUC for each time point. The maximum value is Amax/V. Subtracting each the A/V values from Amax/V give the amount remaining to be absorbed = (Amax-A)/V.
|
|
|
|
|
|
|
|
|
|
|
|
|
|
|
|
|
|
|
|
|
|
|
|
|
|
|
|
|
|
|
|
|
|
|
|
|
|
|
|
|
|
|
|
|
|
|
|
|
|
|
|
|
|
|
|
|
|
|
|
|
|
|
|
|
|
|
|
|
|
|
|
|
|
|
|
|
|
|
|
|
|
|
|
|
|
|
|
|
|
|
|
|
|
|
|
|
|
|
|
|
|
|
|
|
|
|
|
|
|
|
|
|
|
|
|
|
|
|
|
Plotting (Amax-A)/V versus time give:

Thus ka = 0.405 hr-1. Note the Oral AUC is 35.6 mg.hr/L (from the table above using the trapezoidal rule). The IV AUC can be calculated using the trapezoidal rule with Cp(0) = 3.40 to give 21.4 mg.hr/L.
F(oral) = [AUC(oral) • Dose (IV)] / [Dose(oral) • AUC(IV)] = (35.6 x 200) / (450 x 21.4) = 0.739
Question 2.
Use a non-linear regresion program to fit both the IV and oral data from question 1 simultaneously.
Boomer Batch File
    0                             wls,bayes,sim,irwls,sim+error,grid
    1                             Screen, diskfile, printer
HW9912fit
    1                             Parameter type
IV_Dose
   200.0                          Parameter value
    0                             Fixed,adjust,depend1,depend2
    1                             To
    0                             happy or not
    2                             Parameter type
kel_IV
  0.1600                          Parameter value
    1                             Fixed,adjust,depend1,depend2
  0.0000                          Lower limit
   5.000                          Upper limit
    0                             To
    1                             From
    0                             happy or not
   18                             Parameter type
V_IV
   58.80                          Parameter value
    1                             Fixed,adjust,depend1,depend2
   1.000                          Lower limit
   100.0                          Upper limit
    1                             To
[Cp] - IV
    1                             From
    0                             happy or not
   19                             Parameter type
F
  0.7390                          Parameter value
    1                             Fixed,adjust,depend1,depend2
  0.1000                          Lower limit
   1.200                          Upper limit
    0                             happy or not
   19                             Parameter type
Dose_PO
   450.0                          Parameter value
    0                             Fixed,adjust,depend1,depend2
    0                             happy or not
    1                             Parameter type
F*Dose_PO
   332.6                          Parameter value
    3                             Fixed,adjust,depend1,depend2
    5                             Double dependence type
    4                             Dependence-para1
    5                             Dependence-para2
    3                             To
    0                             happy or not
    2                             Parameter type
ka
   0.405                          Parameter value
    1                             Fixed,adjust,depend1,depend2
  0.0000                          Lower limit
   15.00                          Upper limit
    4                             To
    3                             From
    0                             happy or not
    2                             Parameter type
kel_PO
  0.1600                          Parameter value
    2                             Fixed,adjust,depend1,depend2
    2                             Dependence-para
    0                             To
    4                             From
    0                             happy or not
   18                             Parameter type
V_PO
   58.80                          Parameter value
    2                             Fixed,adjust,depend1,depend2
    3                             Dependence-para
    2                             To
[Cp] - PO
    4                             From
    0                             happy or not
   -1                             Parameter type
    2                             Integration method
  0.0000                          Relative error
  0.0000                          Absolute error
    4                             Fitting algorithm
  0.0000                          PC value
Fit to IV and Oral Data
    0                             Data from disk or keyboard
dataiv
    0                             Accept or edit data
datapo
    0                             Accept or edit data
    2                             Weight type
    2                             Weight type
    1                             AUC line number
    2                             AUC line number
    0                             AUC line number
    2                             Continue,save,plot,both
   -2                             wls,bayes,sim,irwls,sim+error,grid
** FINAL OUTPUT FROM Boomer (v2.7.8) ** 29-Sep-1999 --- 10:43:13 pm
Title: Fit to IV and Oral Data
Input: From HW9912fit.BAT
Output: To HW9912fit.OUT
Data for [Cp] - IV came from dataiv.DAT
Data for [Cp] - PO came from datapo.DAT
Fitting algorithm: Simplex Method
Weighting for [Cp] - IV by 1/Cp(Obs )^2
Weighting for [Cp] - PO by 1/Cp(Obs )^2
Numerical integration method: 2) Fehlberg RKF45
with 4 de(s)
With relative error 0.1000E-03
With absolute error 0.1000E-03
PC = 0.1000E-04
** FINAL PARAMETER VALUES ***
# Name Value S.D. C.V. % Lower <-Limit-> Upper
1) kel_IV 0.15939 0.00 5.0
2) V_IV 58.988 1.0 0.10E+03
3) F 0.75249 0.10 1.2
4) ka 0.44561 0.00 15.
AIC = -71.3801 Final WSS = 0.344784E-02
R-squared = 0.9996 Correlation Coeff = 0.9991
** FINAL OUTPUT FROM Boomer (v2.7.8) ** 29-Sep-1999 --- 10:43:14 pm
Title: Fit to IV and Oral Data
Input: From HW9912fit.BAT
Output: To HW9912fit.OUT
Data for [Cp] - IV came from dataiv.DAT
Data for [Cp] - PO came from datapo.DAT
Fitting algorithm: DAMPING-GAUSS/SIMPLEX
Weighting for [Cp] - IV by 1/Cp(Obs )^2
Weighting for [Cp] - PO by 1/Cp(Obs )^2
Numerical integration method: 2) Fehlberg RKF45
with 4 de(s)
With relative error 0.1000E-03
With absolute error 0.1000E-03
DT = 0.1000E-02 PC = 0.1000E-04 Loops = 2
Damping = 1
** FINAL PARAMETER VALUES ***
# Name Value S.D. C.V. % Lower <-Limit-> Upper
1) kel_IV 0.15946 0.389E-02 2.4 0.00 5.0
2) V_IV 58.976 0.960 1.6 1.0 0.10E+03
3) F 0.75260 0.104E-01 1.4 0.10 1.2
4) ka 0.44545 0.114E-01 2.6 0.00 15.
AIC = -71.3806 Final WSS = 0.344771E-02
R-squared = 0.9996 Correlation Coeff = 0.9991
Model and Parameter Definition
# Name Value Type From To Dep Start Stop
1) IV_Dose = 200.0 1 0 1 0 0 0
2) kel_IV = 0.1595 2 1 0 0 0 0
3) V_IV = 58.98 18 1 1 0 0 0
4) F = 0.7526 19 0 0 0 0 0
5) Dose_PO = 450.0 19 0 0 0 0 0
6) F*Dose_PO = 338.7 1 0 3 5004005 0 0
7) ka = 0.4454 2 3 4 0 0 0
8) kel_PO = 0.1595 2 4 0 1002000 0 0
9) V_PO = 58.98 18 4 2 1003000 0 0
Data for [Cp] - IV :-
DATA # Time Calculated Observed (Weight) Weighted residual
1 0.0000 3.39121 0.000000 0.000000 -0.000000
2 1.000 2.89137 2.90000 0.344828 0.297546E-02
3 3.000 2.10185 2.10000 0.476191 -0.879765E-03
4 6.000 1.30271 1.30000 0.769231 -0.208295E-02
WSS for data set 1 = 0.1397E-04
R-squared = 1.000 Correlation Coeff = 1.000
Data for [Cp] - PO :-
DATA # Time Calculated Observed (Weight) Weighted residual
1 0.0000 0.000000 0.000000 0.000000 0.000000
2 0.2500 0.593056 0.600000 1.66667 0.115734E-01
3 0.5000 1.10044 1.10000 0.909091 -0.396208E-03
4 0.7500 1.53207 1.50000 0.666667 -0.213830E-01
5 1.000 1.89682 1.90000 0.526316 0.167157E-02
6 1.500 2.45633 2.50000 0.400000 0.174661E-01
7 2.000 2.83223 2.80000 0.357143 -0.115111E-01
8 3.000 3.19304 3.20000 0.312500 0.217348E-02
9 4.000 3.22091 3.20000 0.312500 -0.653565E-02
10 6.000 2.81817 2.90000 0.344828 0.282164E-01
11 9.000 1.96721 1.90000 0.526316 -0.353718E-01
12 12.00 1.27721 1.30000 0.769231 0.175294E-01
WSS for data set 2 = 0.3434E-02
R-squared = 0.9996 Correlation Coeff = 0.9990
Maximum value for [Cp] - IV is 2.9000 at 1.000
Calculation of AUC and AUMC based on trapezoidal rule
AUC and AUMC for [Cp] - IV using Observed data
Time Concentration AUC AUMC
0.000000 0.000000
1.00000 2.90000 3.14561 1.45000
3.00000 2.10000 8.14561 10.6500
6.00000 1.30000 13.2456 31.8000
21.3983 131.843
MRT = 6.1614
Calculation of AUC and AUMC using Method 9 of R.D. Purves
AUC and AUMC for [Cp] - IV using Observed data
Time Concentration AUC AUMC
0.000000 0.000000
1.00000 2.90000
3.00000 2.10000 8.10000 13.7250
6.00000 1.30000 13.1045 35.6473
21.2571 135.691
MRT = 6.3833
Maximum value for [Cp] - PO is 3.2000 at 3.000
Calculation of AUC and AUMC based on trapezoidal rule
AUC and AUMC for [Cp] - PO using Observed data
Time Concentration AUC AUMC
0.000000 0.000000
0.250000 0.600000 0.750000E-01 0.187500E-01
0.500000 1.10000 0.287500 0.106250
0.750000 1.50000 0.612500 0.315625
1.00000 1.90000 1.03750 0.693750
1.50000 2.50000 2.13750 2.10625
2.00000 2.80000 3.46250 4.44375
3.00000 3.20000 6.46250 12.0438
4.00000 3.20000 9.66250 23.2438
6.00000 2.90000 15.7625 53.4438
9.00000 1.90000 22.9625 105.194
12.0000 1.30000 27.7625 154.244
36.7916 325.305
MRT = 8.8418
Calculation of AUC and AUMC using Method 9 of R.D. Purves
AUC and AUMC for [Cp] - PO using Observed data
Time Concentration AUC AUMC
0.000000 0.000000
0.250000 0.600000
0.500000 1.10000 0.291667 0.958333E-01
0.750000 1.50000 0.618750 0.302344
1.00000 1.90000 1.04479 0.677214
1.50000 2.50000 2.15451 2.07687
2.00000 2.80000 3.49062 4.42131
3.00000 3.20000 6.54618 12.0935
4.00000 3.20000 9.79062 23.4491
6.00000 2.90000 16.1017 54.9046
9.00000 1.90000 23.7101 111.217
12.0000 1.30000 28.6642 162.786
37.6934 333.847
MRT = 8.8569
Plots of observed (*) and calculated values (+)
versus time for [Cp] - IV . Superimposed points (X)
3.391 Linear 3.391 Semi-log
|+ |+
| |
| |
| |
| |
| X | X
| |
| |
| |
| |
| |
| |
| X |
| |
| |
| | X
| |
| |
| |
| X |
| |
| |
| |
| |
| |
| |
| |
| |
| |
| |
|* | X
|_____________________________________ |*____________________________________
0.0000 1.300
0 <--> 6.0 0 <--> 6.0
Plot of Std Wtd Residuals (X) Plot of Std Wtd Residuals (X)
versus time for [Cp] - IV versus calcd Cp(i) for [Cp] - IV
0.1755 0.1755
| X | X
| |
| |
| |
| |
| |
| |
| |
| |
| |
0X==================================== 0====================================X
| |
| |
| X | X
| |
| |
| X |X
| |
-0.1229 -0.1229
0.00 <--> 6.0 1.3 <--> 3.4
Plots of observed (*) and calculated values (+)
versus time for [Cp] - PO . Superimposed points (X)
3.221 Linear 3.221 Semi-log
| + | +
| X * | X *
| | *
| * | X +
| X + |
| | X
| |
| * |
| + |
| | +
| | X *
| |
| + |
| X * |
| | X
| |
| + |
| * | X
| * |
| + |
| X | X
| |
| |
| |
| |
|X |
| |
| |
| |
| |
|X |X
|_____________________________________ |X____________________________________
0.0000 0.5931
0 <--> 12. 0 <--> 12.
Plot of Std Wtd Residuals (X) Plot of Std Wtd Residuals (X)
versus time for [Cp] - PO versus calcd Cp(i) for [Cp] - PO
1.665 1.665
| X | X
| |
| |
| X X | X X
| |
|X | X
| |
| X X | X X
0XX=================================== 0X===========X========================
| X | X
| X | X
| |
| |
| X | X
| |
| |
| X | X
| |
-2.087 -2.087
0.00 <--> 12. 0.00 <--> 3.2
Plot of Std Wtd Residuals (X) Plot of Std Wtd Residuals (X)
versus time for all data versus calcd Cp(i) for all data
1.665 1.665
| X | X
| |
| |
| X X | X X
| |
|X | X
| |
| X X | X X X
0XX=======X========X================== 0X==========X=X========X=============X
| X | X
| X | X
| |
| |
| X | X
| |
| |
| X | X
| |
-2.087 -2.087
0.00 <--> 12. 0.00 <--> 3.4
Question 3.
Given the model in Figure 1 and the data in Table 3 determine which of the parameters of this model are identifiable. Use either the numerical / empical approach and/or the analytical / Laplace transform approach. [Some additional information: The parameter values that I used to generate the data below are ke = 0.1 hr-1, km1 = 0.05 hr-1, km2 = 0.1 hr-1, and V1 = 20 L.]

Table 3
Plasma Concentration after an IV Bolus Dose of 200 mg
|
(hr) |
|
(hr) |
|
|
|
|
|
|
|
|
|
|
|
|
|
|
|
|
|
|
|
|
|
|
|
|
|
|
|
|
|
|
|
|
|
|
|
|
|
|
|
|
|
Boomer Batch File
    0                             wls,bayes,sim,irwls,sim+error,grid
    1                             Screen, diskfile, printer
HW9912ident
    1                             Parameter type
Dose
   200.0                          Parameter value
    0                             Fixed,adjust,depend1,depend2
    1                             To
    0                             happy or not
    2                             Parameter type
ke
  0.1000                          Parameter value
    1                             Fixed,adjust,depend1,depend2
  0.0000                          Lower limit
   5.000                          Upper limit
    2                             To
    1                             From
    0                             happy or not
    2                             Parameter type
km1
  0.5000E-01                      Parameter value
    1                             Fixed,adjust,depend1,depend2
  0.0000                          Lower limit
   5.000                          Upper limit
    0                             To
    1                             From
    0                             happy or not
    2                             Parameter type
km2
  0.1000                          Parameter value
    1                             Fixed,adjust,depend1,depend2
  0.0000                          Lower limit
   5.000                          Upper limit
    0                             To
    1                             From
    0                             happy or not
   18                             Parameter type
V
   20.00                          Parameter value
    1                             Fixed,adjust,depend1,depend2
   1.000                          Lower limit
   100.0                          Upper limit
    1                             To
Cp
    1                             From
    0                             happy or not
   18                             Parameter type
One
   1.000                          Parameter value
    0                             Fixed,adjust,depend1,depend2
    2                             To
U
    2                             From
    0                             happy or not
   -1                             Parameter type
    2                             Integration method
  0.0000                          Relative error
  0.0000                          Absolute error
    4                             Fitting algorithm
  0.0000                          PC value
HW9912 - Identifiabilty Problem
    1                             Data from disk or keyboard
  0.0000                          X value
  0.0000                          Y value
  0.5000                          X value
   8.800                          Y value
   1.000                          X value
   7.800                          Y value
   1.500                          X value
   6.900                          Y value
   2.000                          X value
   6.100                          Y value
   4.000                          X value
   3.700                          Y value
   6.000                          X value
   2.200                          Y value
   9.000                          X value
   1.100                          Y value
   12.00                          X value
  0.5000                          Y value
  -1.000                          X value
    0                             Accept, correct, delete, insert, of
    0                             Continue or save data
  0.0000                          X value
  0.0000                          Y value
   1.000                          X value
   17.70                          Y value
   2.000                          X value
   31.50                          Y value
   4.000                          X value
   50.60                          Y value
   6.000                          X value
   62.20                          Y value
   9.000                          X value
   71.60                          Y value
   12.00                          X value
   76.00                          Y value
  -1.000                          X value
    0                             Accept, correct, delete, insert, of
    0                             Continue or save data
    3                             Weight type
  0.2500E-02                      Weight value - A
   2.000                          Weight value - B
    3                             Weight type
   16.00                          Weight value - A
  0.0000                          Weight value - B
    0                             AUC line number
    2                             Continue,save,plot,both
   -4                             wls,bayes,sim,irwls,sim+error,grid
HW9912ident
This .BAT file will run until the program is quit by the user so you can do 10 or more fits/runs in one session. [Note the -4 on the second last line and the name of the .BAt on the last line.]
                    ** FINAL PARAMETER VALUES ***

  #  Name                  Value       S.D.       C.V. %  Lower <-Limit-> Upper

  1) ke                    0.99660E-01  0.735E-03  0.74      0.00       5.0
  2) km1                   0.33915E-01   1.87      0.55E+04  0.00       5.0
  3) km2                   0.11505       1.88      0.16E+04  0.00       5.0
  4) V                      20.013      0.126      0.63       1.0      0.10E+03

 AIC =    1.61444     Final WSS =   0.633743
               R-squared =   0.9999     Correlation Coeff =    1.000
--
                    ** FINAL PARAMETER VALUES ***

  #  Name                  Value       S.D.       C.V. %  Lower <-Limit-> Upper

  1) ke                    0.99667E-01                       0.00       5.0
  2) km1                   0.54763E-01                       0.00       5.0
  3) km2                   0.94187E-01                       0.00       5.0
  4) V                      20.013                            1.0      0.10E+03

 AIC =    1.61402     Final WSS =   0.633724
               R-squared =   0.9999     Correlation Coeff =    1.000
---
                    ** FINAL PARAMETER VALUES ***

  #  Name                  Value       S.D.       C.V. %  Lower <-Limit-> Upper

  1) ke                    0.99666E-01                       0.00       5.0
  2) km1                   0.66782E-01                       0.00       5.0
  3) km2                   0.82166E-01  0.230E+09  0.28E+12  0.00       5.0
  4) V                      20.013      0.230       1.1       1.0      0.10E+03

 AIC =    1.61409     Final WSS =   0.633728
               R-squared =   0.9999     Correlation Coeff =    1.000
---
                    ** FINAL PARAMETER VALUES ***

  #  Name                  Value       S.D.       C.V. %  Lower <-Limit-> Upper

  1) ke                    0.99678E-01                       0.00       5.0
  2) km1                   0.48799E-01                       0.00       5.0
  3) km2                   0.10014                           0.00       5.0
  4) V                      20.013                            1.0      0.10E+03

 AIC =    1.61402     Final WSS =   0.633724
               R-squared =   0.9999     Correlation Coeff =    1.000
---
                    ** FINAL PARAMETER VALUES ***

  #  Name                  Value       S.D.       C.V. %  Lower <-Limit-> Upper

  1) ke                    0.99678E-01                       0.00       5.0
  2) km1                   0.48799E-01                       0.00       5.0
  3) km2                   0.10014      0.230E+09  0.23E+12  0.00       5.0
  4) V                      20.013      0.230       1.1       1.0      0.10E+03

 AIC =    1.61402     Final WSS =   0.633724
               R-squared =   0.9999     Correlation Coeff =    1.000
---
                    ** FINAL PARAMETER VALUES ***

  #  Name                  Value       S.D.       C.V. %  Lower <-Limit-> Upper

  1) ke                    0.99672E-01                       0.00       5.0
  2) km1                   0.49467E-01                       0.00       5.0
  3) km2                   0.99489E-01                       0.00       5.0
  4) V                      20.012                            1.0      0.10E+03

 AIC =    1.61402     Final WSS =   0.633724
               R-squared =   0.9999     Correlation Coeff =    1.000
---
                    ** FINAL PARAMETER VALUES ***

  #  Name                  Value       S.D.       C.V. %  Lower <-Limit-> Upper

  1) ke                    0.99673E-01  0.708E-03  0.71      0.00       5.0
  2) km1                   0.77701E-01                       0.00       5.0
  3) km2                   0.71251E-01                       0.00       5.0
  4) V                      20.011      0.123      0.61       1.0      0.10E+03

 AIC =    1.61403     Final WSS =   0.633725
               R-squared =   0.9999     Correlation Coeff =    1.000
---
                    ** FINAL PARAMETER VALUES ***

  #  Name                  Value       S.D.       C.V. %  Lower <-Limit-> Upper

  1) ke                    0.99666E-01                       0.00       5.0
  2) km1                   0.48992E-01                       0.00       5.0
  3) km2                   0.99991E-01                       0.00       5.0
  4) V                      20.008                            1.0      0.10E+03

 AIC =    1.61570     Final WSS =   0.633800
               R-squared =   0.9999     Correlation Coeff =    1.000
---
                    ** FINAL PARAMETER VALUES ***

  #  Name                  Value       S.D.       C.V. %  Lower <-Limit-> Upper

  1) ke                    0.99669E-01  0.126E-02   1.3      0.00       5.0
  2) km1                   0.14682      0.159      0.11E+03  0.00       5.0
  3) km2                   0.21498E-02  0.160      0.74E+04  0.00       5.0
  4) V                      20.010      0.174      0.87       1.0      0.10E+03

 AIC =    1.61441     Final WSS =   0.633742
               R-squared =   0.9999     Correlation Coeff =    1.000
---
                    ** FINAL PARAMETER VALUES ***

  #  Name                  Value       S.D.       C.V. %  Lower <-Limit-> Upper

  1) ke                    0.99671E-01                       0.00       5.0
  2) km1                   0.50268E-01                       0.00       5.0
  3) km2                   0.98686E-01                       0.00       5.0
  4) V                      20.012                            1.0      0.10E+03

 AIC =    1.61405     Final WSS =   0.633725
               R-squared =   0.9999     Correlation Coeff =    1.000
Note that the values of ke and V are consistent across all 10 runs. Thus they are (probably) identifiable. Are the kel values (= ke + km1 + km2) values consistent? kel was consistently 0.2486.
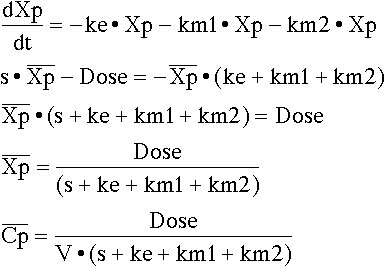
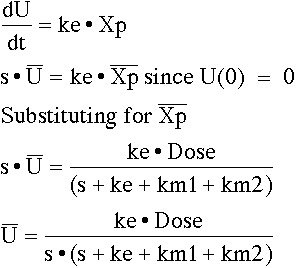
Write the differential equation for the data supplied and take the Laplace of these equations before evaluating whether parameters are identifiable.

From the 's' term we can see that ke + km1 + km2 is identifiable in total but not the separate components. That is kel (= ke + km1 + km2) is identifiable. From the 'intercept' term Dose/V we know that V is identifiable since we know Dose.

From the 's' term we can see that ke + km1 + km2 is identifiable in total but not the separate components. That is kel (= ke + km1 + km2) is identifiable (again). From the 'intercept' term ke • Dose we know that ke is identifiable since we know Dose.