 calculations


 calculations
Then
 =
=

If ka >> kel then
Cpmin =

R = e-0.3 * 6 = 0.165
Cpmin = 3.7 mg/L
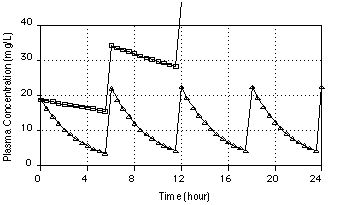
These are the results you should expect in a patient with a normal creatinine clearance value. However in a patient with a creatinine clearance of only 10 ml/min the elimination rate constant will be quite different and if the same dosage regimen were used quite different plasma concentrations would be achieved (see Figure XVI-6). The elimination rate constant for this patient would be 0.034 hr-1 (t1/2 = 20 hr). Using the same dosing regimen:

This average plasma concentration is well above the 35 mg/L which should be avoided (in the PDR 89 p740). Clearly some dosage adjustment should be made to the dosage regimen.

Figure XVI-6 Linear Plot of Cp versus Time
We should consider
a) changing the dose
b) changing the dosing interval
c) changing both the dose and the dosing interval.
We can make these alterations easily using the  equation

From this we can see that decreasing the dose or increasing the dosing interval will have the desired response.
 =
=

Assuming ka >> kel, R = 0.815 and Cpmin = 9.3 mg/L
Thus this new dosing regimen of 28 mg every 6 hours should work
 =
=

Therefore giving 250 mg every 53 hours should achieve a satisfactory plasma concentration profile.
R = 0.165; Cpmin = 3.7 mg/L
We would expect greater fluctuations with this method and dosing every 53 hours is not all that convenient. Every 6 hours is not all that great either if a longer dosing interval would work. We might consider dosing every 24 hours.
 =
=
 = 113 mg every 24 hours (maybe 100 mg every 24 hours)
R = 0.442; Cpmin = 6.7 mg/L.

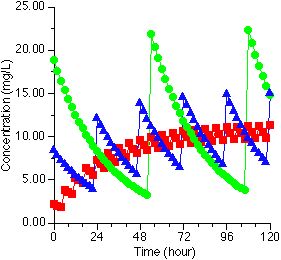
Figure XVI-8, Plot of Cp versus Time
The lines in Figure XVI-8 were calculated to achieve a
 of 10.4 mg/L using 28 mg q6h, 250 mg q54h, pr 113 mg q24h.
Similar plots can be generated with lab programs
 Equation
Copyright 2001 David W.A. Bourne


