return to the Course index
previous | next

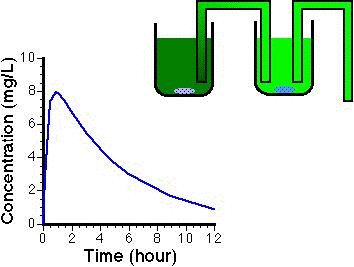
Fig 3.7.1 Slide of oral curve and beakers. We can picture oral administration as water flowing from one bucket (representing the GI tract) into a second beaker (representing the body). At first drug flows into the 'body' beaker and the level rises, as drug concentration rises, then after peaking the levels start to fall as elimination overtakes absorption. This can be represented as an experiment in lab where the body is represented as a beaker. In the lab experiment a dye concentration represents drug concentration in the body.
Material on this website should be used for Educational or Self-Study Purposes Only
Copyright © 2001 - 2026 David W. A. Bourne (david@boomer.org)
 | An iPhone app that allows the input of up to four locations (latitude and longitude) and provides the user's distance from each location |
|