|
|
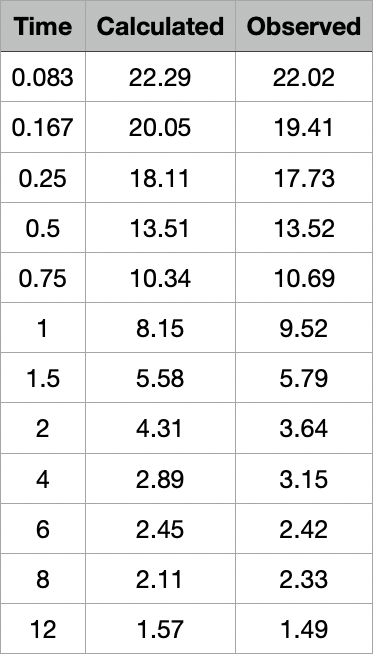
Table 9.3.1 Table of observed and calculated data
| Boomer Manual and Download | ||||
| PharmPK Listserv and other PK Resources | ||||
| Previous Page | Course Index | Next Page | ||
|
|
|
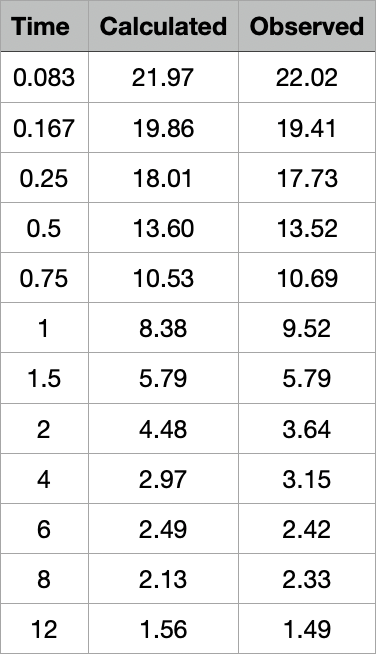
Table 9.3.1 Table of observed and calculated data
Notice the similarities between the Calculated and Observed Data indicating a reasonably good fit to the data.
|
|
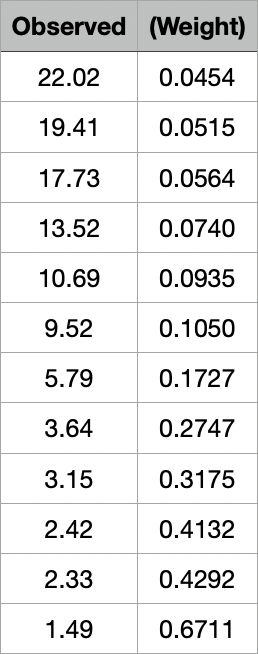
Table 9.3.2 Table of observed data and SQRT(weight)
You should look for very high or very low weight values which may indicate data entry errors or outliers. Possibly another weighting scheme may be more suitable.
|
|
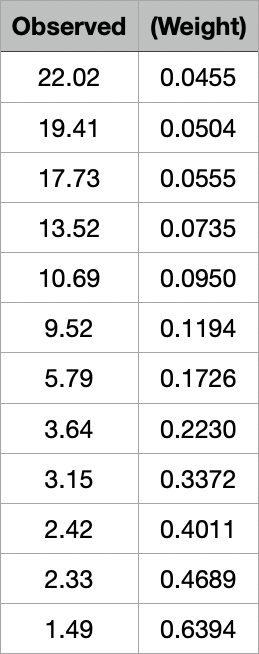
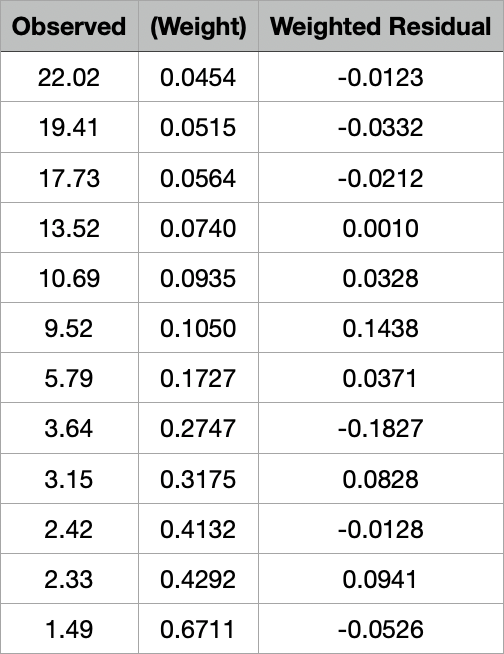
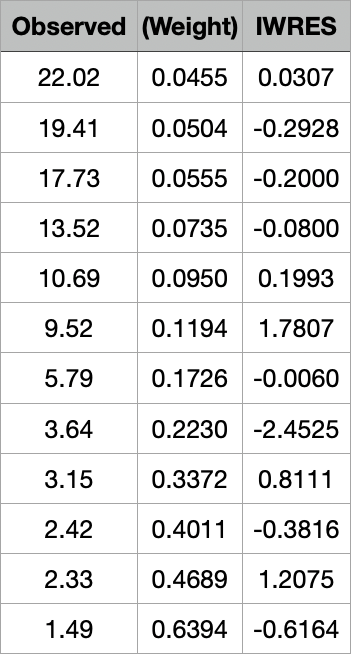
Table 9.3.3 Table of Observed Data and the Weighted Residuals
This table of weighted residuals can be quite instructive. A good fit would be indicated by weighted residuals with similar values and random change of sign. This would indicate that the best fit line was between the observed data points.
iBook and pdf versions of this material and other PK material is available
Copyright © 2001-2022 David W. A. Bourne (david@boomer.org)