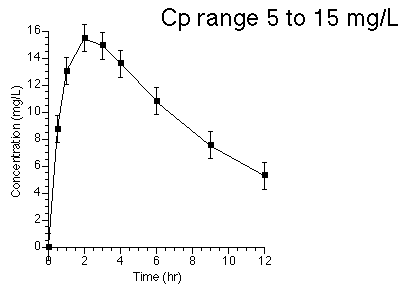
Figure 29.3.1 Drug concentrations after Oral Administration
return to the Course index
previous | next
Figure 29.3.1 Drug concentrations after Oral Administration
The range in concentration values in Figure 29.3.1 is quite modest. These may be analyzed successfully using equal weight for each data point.
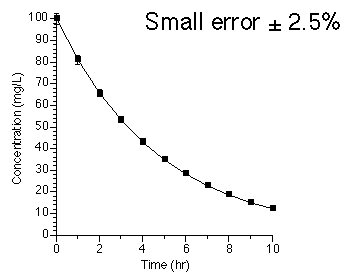
Figure 29.3.2 Concentration versus Time with small error bars
The deficiencies associated with the equal weight scheme are more pronounced when trying to fit more than one data set simultaneously. In these cases, careful consideration of weighting between and within the data sets is important.
iBook and pdf versions of this material and other PK material is available
Copyright © 2001-2022 David W. A. Bourne (david@boomer.org)