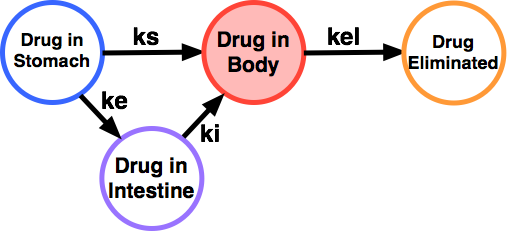
Figure 11.3.1 One Compartment Model with Absorption from Stomach and Intestine
Figure 11.3.1 One Compartment Model with Absorption from Stomach and Intestine
The equations for this model after Oral Absorption was developed using Laplace transforms. References Heading, R.C., Nimmo, J., Prescott, L.F. and Tothill, P. 1973. The dependence of paracetamol absorption on the rate of gastric emptying, Br. J. Pharmacol., 47, 415-421
iBook and pdf versions of this material and other PK material is available
Copyright © 2001-2022 David W. A. Bourne (david@boomer.org)