


Figure IV-7. Linear Plot of Cp versus Time showing AUC and AUC segment
We can continue by looking at two more parameters. These are the area under the plasma concentration time curve (AUC) and the half-life of elimination. First AUC. The AUC value is very useful for calculating the relative efficiency of different drug products (We'll talk about this later). It will also give us another method of calculating the apparent volume of distribution, not just from Cp0.
The AUC is calculated by adding these segments together. Each very narrow segment has an area = Cp*dt. Thus the total area has the area, AUC.
Equation IV-16. AUC for a Very Narrow Segment
calculus uses very narrow segments
![]()
then
at t = 0, e- kel*t = 1
at t = ![]() , e- kel*t = 0
, e- kel*t = 0
Therefore
![]()
or
![]()
Equation IV-17. AUC Calculated from Concentration and kel
Analytical integration (exact solution, given exact values for V and kel)
[Note: From t = 0 - > t = [[infinity]], AUC = Cp0/kel and for t = t - > t= [[infinity]] , AUC = Cpt/kel]
or
![]()
Equation IV-18. Volume of Distribution Calculated from Dose, AUC and kel
We could use equation 20 to calculate the AUC value if we knew DOSE, kel, and V; but usually we don't and have to calculate AUC directly from the Cp versus time data.
We need then a different approach, which is called the trapezoidal rule. Numerical (approximate) solution
a) Trapezoidal rule
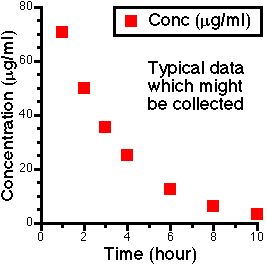
Figure IV-8. Linear Plot of Cp versus Time showing Typical Data Points
We can calculate the AUC of each segment if we consider the segments to be trapezoids. [Four sided figures with two parallel sides].
The area of each segment is then given by the average concentration x segment width.
![]()
See Figure IV-9 below
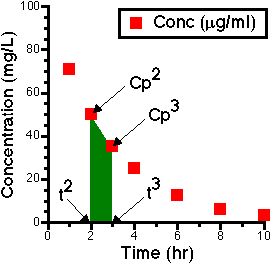
Figure IV-9. Linear Plot of Cp versus Time showing One Trapezoid
The area from the first to last data point can then be calculated by adding the areas together.
Note: Summation of data point information (non-calculus)
This gives:
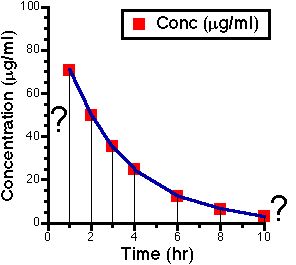
Figure IV-10. Linear plot of Cp versus time showing areas from data 1 to data n
We now have two more areas to consider. The first and the last.
First if we give a rapid I.V. bolus the zero plasma concentration Cp0 can be determined by extrapolation.
Thus
The final segment can be calculated if we go back to the mathematical equation.
![]()
![]() can be derived
can be derived
Therefore the total AUC can be calculated as :-
![]()
![]()
![]()
Table IV-4. Calculation of AUC
Time (hr) | Concentration (µg/ml) | delta AUC | AUC (µg.hr/ml) |
| 0 | 100 | ||
| 1 | 71 | 85.5 | 85.5 |
| 2 | 50 | 60.5 | 146.0 |
| 3 | 35 | 42.5 | 188.5 |
| 4 | 25 | 30.0 | 218.5 |
| 6 | 12 | 37.0 | 255.5 |
| 8 | 6.2 | 18.2 | 273.7 |
| 10 | 3.1 | 9.3 | 283.0 |
| Total | 8.9 | 291.9 |
Copyright 2002 David W.A. Bourne