


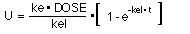
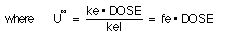
(Equation V-8)
Figure V-4. Linear Plot of U versus Time showing Approach to U not equal to DOSE
Cumulative Amounts Excreted as Unchanged Drug into Urine Plots
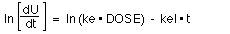
Equation V-15. Natural log of Rate of Excretion versus Time
Note: ke * DOSE not kel * DOSE
Figure V-5. Semi-log Plot of ![]() U/
U/![]() t versus Timemidpoint Showing Slope = - kel
t versus Timemidpoint Showing Slope = - kel
Rate of Excretion as Unchanged Drug into Urine Plots
 (Equation V-8)
= U - U * e- kel * t
(U - U) = U * e- kel * t
then ln (U - U) = ln U- kel * t
 Note ke
Thus,
![]()
Figure V-6. Semi-Log Plot of A.R.E. versus Time
Amount Remaining to be Excreted as Unchanged Drug into Urine Plots
Copyright 2002 David W.A. Bourne
