


 |
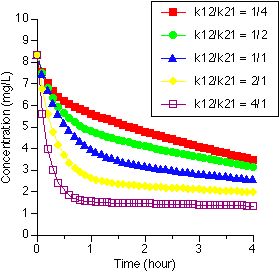
| Figure XIX-6, Plot of Cp versus Time Showing the Effect of Different k12/21 Ratio Values |
As the ratio increases the distribution phase is more pronounced. Conversely with the ratio 1/4 there is very little distribution phase. Also note that the ![]() value or the slope of the terminal phase is changing even though the kel is fixed at 0.2 hr-1.
value or the slope of the terminal phase is changing even though the kel is fixed at 0.2 hr-1.
With faster and faster distribution the initial drop in plasma concentration becomes quite rapid. If you were sampling every 30 minutes, the initial phase would be missed. The data would look just like a one compartment model. Redrawing the slow plot with k12/k21 (0.5/0.25) over 24 hours and gives a plot that is definitely still biexponential.
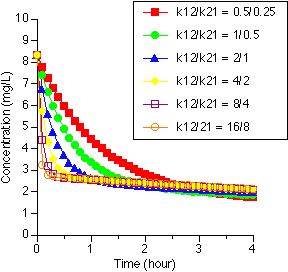 |
| Figure XIX-7, Plot of Cp versus Time Showing the Effect of the Magnitude of k12 and k21 |
Copyright 2001 David W.A. Bourne