return to the Course index
previous | next
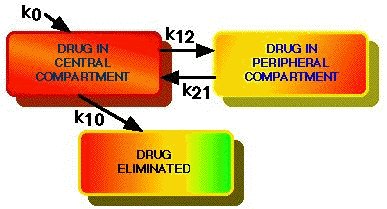
Fig 3.9.1 A diagram of a two compartment model showing the parameters to be measured. The processes of distribution and excretion can be represented by the rate constants k12, k21, and k10. The rate constant k0 representing an infusion or absorption process. The drug appears to be dissolved in the body volume. This volume is the 'apparent' volume of distribution.
Material on this website should be used for Educational or Self-Study Purposes Only
Copyright © 2001 - 2026 David W. A. Bourne (david@boomer.org)
 | Pharmacy Math Part Two A selection of Pharmacy Math Problems |
 |