return to the Course index
previous | next
redrawn from Barr, 1968
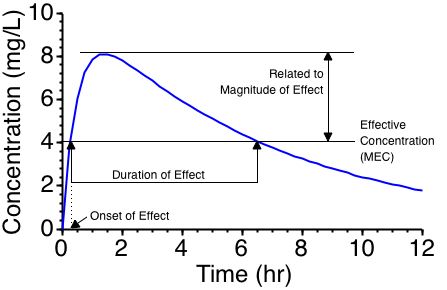
Fig 3.10.1 Slide showing effect as a function of time. From a graph such as this we can see the relationship between drug concentration and drug effect. If a drug has to reach an effective concentration at a receptor site this will be reflected as a required blood concentration.
Material on this website should be used for Educational or Self-Study Purposes Only
Copyright © 2001 - 2026 David W. A. Bourne (david@boomer.org)
 | Pharmacy Math Part Two A selection of Pharmacy Math Problems |
 |