return to the Course index
previous | next
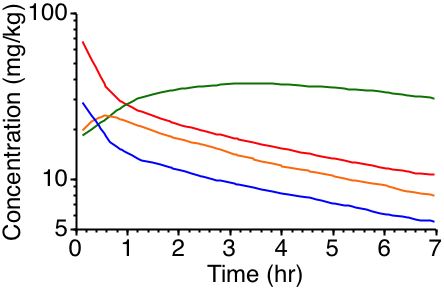
redrawn from Bischoff and Dedrick, 1968
Figure 3.28.1 Slide showing pentobarbital concentrations in various tissues. This illustrates the slow distribution of some drugs into and out of various tissues. Brain and other rapidly perfused tissues rapidly lose drug while other tissues are building up drug concentrations. Eventually significant amounts of drug will be collected in fat tissue from which it may only slowly be removed. The green line represents concentrations in adipose tissue (poorly perfused), the red line represents concentrations in viscera (highly perfused lean tissue), the orange line represents concentrations in lean tissue (poorly perfused) and the blue line represents concentrations in blood.
Material on this website should be used for Educational or Self-Study Purposes Only
Copyright © 2001 - 2026 David W. A. Bourne (david@boomer.org)
 | A game to aid in interpreting Prescription Sig instructions See how many Sigs you can catch before you run out of lives |
|