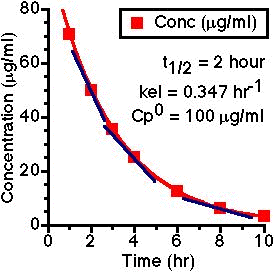
Figure 4.3.1. Concentration versus time
return to the Course index
previous | next
To illustrate first order kinetics we might consider what would happen if we were to give a drug by iv bolus injection, collect blood samples at various times and measure the plasma concentrations of the drug. We might see a steady decrease in concentration as the drug is eliminated, as shown in Figure 4.3.1.

Figure 4.3.1. Concentration versus time
Rate versus Cp
If we measure the slope of this curve at a number of times we are actually measuring the rate of change of concentration at each time point, ΔCp/Δt, represented by the straight line tangents in Figure 4.3.2.

Figure 4.3.2 Same as Figure 4.3.1 with Tangents shown
Now if we plot this rate of change versus the plasma concentration, for each data point, we will get a straight line when first order kinetics are obeyed. This is shown in Figure 4.3.3.

Figure 4.3.3 Plot of ΔCp/Δt versus Cp for first order process
This behavior can be expressed mathematically as:-

Equation 4.3.1
Material on this website should be used for Educational or Self-Study Purposes Only
Copyright © 2001 - 2026 David W. A. Bourne (david@boomer.org)
 | An iPhone app that facilitates the geotagging of Bird Count stops and the return to the same stops during the next and subsequent Bird Count sessions |
|