Equation 19.4.1 Akaike's Information criterion, AIC
| Boomer Manual and Download | ||||
| PharmPK Listserv and other PK Resources | ||||
| Previous Page | Course Index | Next Page | ||
Equation 19.4.1 Akaike's Information criterion, AIC
In Equation 19.4.1 N is the number of data points, excluding any data with zero weight (that might be used as place markers at time zero or when a dose is given). M is the number of adjustable parameters.
When comparing two or more models the lowest number is 'best'. That is, the LOWEST number on the number line from plus to minus infinity. For example,
Notice the inclusion of WSS or weighted sum of squared residual in Equation 19.4.1. It is VERY important that when a comparison is made that the weighting scheme used in the analysis of each model is the same. If you change the weighting scheme the weights and thus the WSS value is changed too. Use the same weighting scheme! This does not mean you can't try other weighting scheme but you must be careful with the comparison. Consider the matrix.
| Model A - Weight Scheme A | Model B - Weight Scheme A |
| Model A - Weight Scheme B | Model B - Weight Scheme B |
Comparison of weighting schemes can be made down the table on either side. Determination of the best model must be made across the table, NOT down.
As an example the analysis of a data set containing 12 data points using three different models with the same weighting scheme produced the results.
| M | N | WSS | AIC Value | |
| One Compartment Model | 2 | 12 | 2.02 | 12.4 |
| Two Compartment Model | 4 | 12 | 0.0769 | -22.8 |
| Three Compartment Model | 6 | 12 | 0.0769 | -18.8 |
In this example the lowest AIC is -22.8 for the two compartment model.
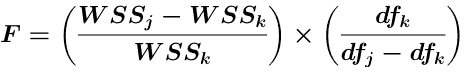
Equation 19.4.2 F Value
In Equation 19.4.2 df is the degrees of freedom calculated as N - M (see above). The indexes j and k refer to the two models being compared. The model with the higher number of parameters is indexed as k.
| Calculated F | Tabled F 5% level | n, m | |
| 1 vs 2 | 101 | 4.46 | 2, 8 |
| 2 vs 3 | 0 | 5.14 | 2, 6 |
n = dfj - dfk
m = dfk
The idea is to compare the calculated value with the tabled value. A calculated value higher than the table value supports the larger model as being significantly better. In Table 19.4.3 the two compartment model is better than the one compartment model since 101 is larger than 4.46. In comparison, the three compartment offers no significant improvement over the two compartment model since the calculated value, 0, is less than the tabled value, 5.14.
Selecting the best model takes care and experience. There are a variety of criteria that must be considered.
iBook and pdf versions of this material and other PK material is available
Copyright © 2001-2022 David W. A. Bourne (david@boomer.org)