Figure 22.2.1 Direct Reversible Response
return to the Course index
previous | next
Figure 22.2.1 Direct Reversible Response
In general the receptor might be 'mathematically' within the central compartment, a peripheral compartment or a separate effect compartment. In each case the relationship between concentration at the receptor and the response might be described with a Sigmoid Emax model (Hill equation)

Equation 22.2.1 Sigmoid Emax Response versus Concentration, CR (Hill Equation)

Equation 22.2.2 Sigmoid Emax Response versus Concentration, CR (Hill Equation) with Baseline Response
In Equations 22.2.1 and 22.2.2, Emax is the maximum response, CR, 50% is the concentration which produces a 50% maximum response (often called EC50%) and γ is a slope factor. For responses which increase from zero, Equation 22.2.1 is more appropriate. In other cases where the response is an increase or decrease from a baseline value Equation 22.2.2 may be a better choice. Another version of this equation, Equation 22.2.1, is the Emax model but this is just the same except that γ is set to 1.
Equation 22.2.1 can be illustrated in Figure 22.2.2 as a sigmoid curve.
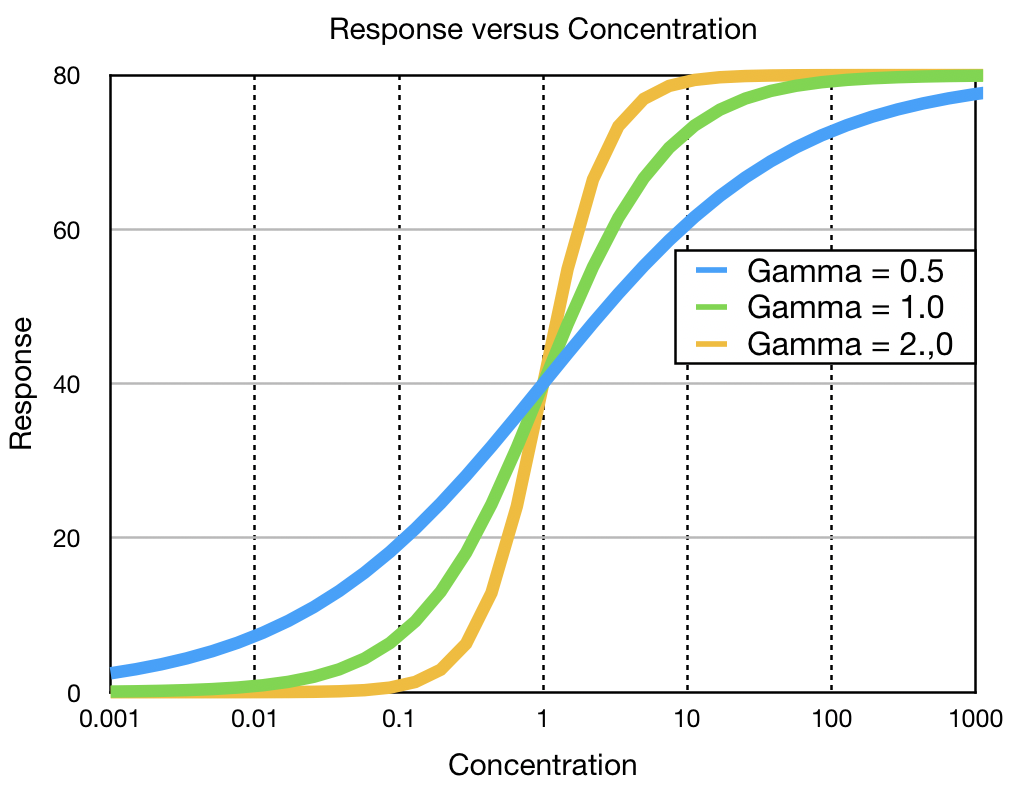
where Emax is 80, CR, 50% is 1 and gamma is 0.5, 1 or 2.
With data such as response versus concentration we could readily fit the data with a Hill equation model using Boomer, SAAM II or some other non-linear regression program. We could also add appropriate weight to the data and include a second response to a fitted model.
Another approach is to rearrange the Hill equation to produce a Logarithmic model, Equation 22.2.3.

Equation 22.2.3 Linear version of the Hill equation
Plotting log[Response/(Emax - Response)] versus log(CR) should produce a straight line graph with a slope of γ and intercept of -log CγR, 50%.
Another more commonly used Logarithmic model can be derived empirically from the Hill equation if we look at the response versus log concentration plot between 20 to 80% maximum response. Notice the straight line portion.

Figure 22.2.3 Plot of Response versus Concentration with log-linear portion
This region of the full response concentration curve can be described by Equation 22.2.4.
Equation 22.2.4 Logarithmic model for the middle part of the curve
This might be useful if the concentration isn't high enough to estimate Emax. It is also interesting to consider concentrations after an IV bolus, one compartment model in this log form, equating plasma concentration and receptor concentration assuming the receptor is close to the plasma or central compartment.

Equation 22.2.5 log(C) versus time
and

Equation 22.2.6 Response versus time
Note that with this scenario the response decreases linearly with time. One example of this is the results after the last dose of a one week regimen of labetalol (Derendorf and Hochhaus 1995).
With each of these variations we see a direct, immediate relationship between response and concentration. The higher the concentration the higher the response. Note, the receptor may be within the central compartment or a peripheral compartment. It might be in a region where there is little drug amount and thus doesn't show up as a distinct 'pharmacokinetic' compartment. For this situation we might need to include a 'small' effect compartment. We can explore this by looking at the relationship between response and concentration in various compartments.
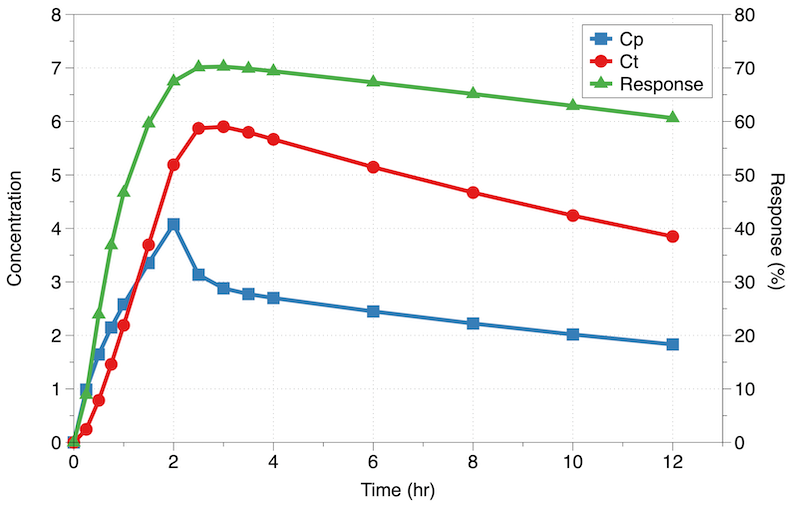
Figure 22.2.4 Plot of Cp, Ct and Response versus Time
One way to explore this aspect of the model, that is, where is the receptor, is to plot response versus concentration. In Figure 22.2.5 we plot response versus the concentration in the central compartment.
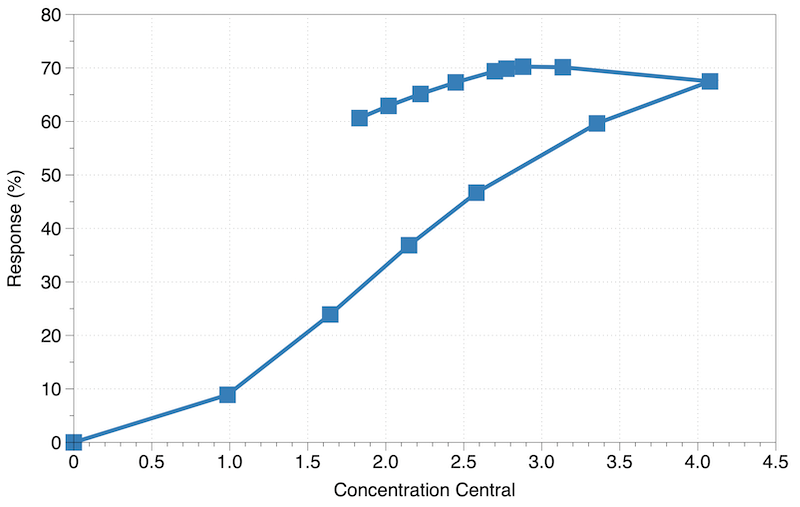
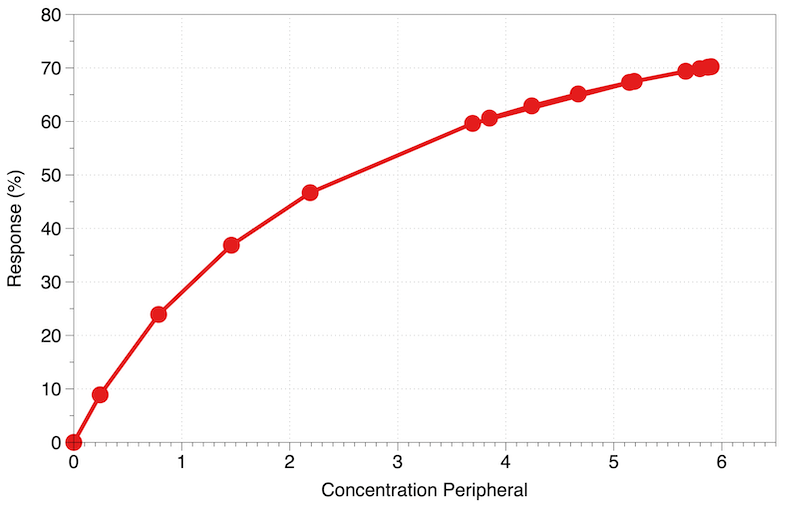
Figure 22.2.5 Response versus Concentration in the Central or Peripheral compartment
In the left panel there is a significant difference in response between the increasing concentration and decreasing concentration (a counterclockwise hysteresis curve) we might assume that the receptor is not in the central compartment. The same plot for the concentration in the tissue or peripheral concentration is shown on the right panel. Note the increasing and decreasing concentration data overlap indicating the receptor for this response is in the peripheral compartment. Wagner et al. (1968) found the response to LSD could be correlated with peripheral drug concentration. A response to digoxin was also correlated with peripheral drug concentrations (Reuning, 1973).
In other case there may not be a correlation between central or peripheral concentrations. For these drugs we might include a hypothetical effect compartment as shown in Figure 22.2.6 (Sheiner et al., 1979).

Figure 22.2.6 Pharmacokinetic Model with Effect Compartment
Want to explore this type of model!
Material on this website should be used for Educational or Self-Study Purposes Only
Copyright © 2001 - 2026 David W. A. Bourne (david@boomer.org)
 | Pharmacy Math Part One A selection of Pharmacy Math Problems |
 |