Chapter 23
Pharmaceutical Analysis
return to the Course index
previous | next
High Performance (Pressure) Liquid Chromatography (HPLC)
The General Approach
- Collect blood sample
- Separate plasma (partial clean-up)
- Extraction into organic solvent (polarity/pH)
- Injection onto column
- Separation on column
- Quantitation with detector
- Record and analyse results
HPLC Instrumentation
- Solvent Reservoir
- Pump
- High pressure - 1000 to 5000 psi
- Injector
- Low pressure - stop flow
- High pressure value
- Column
- Normal Phase - organic (water-free) mobile phase
- Silica gel - non-aqueous
- Adsorption
- Reverse phase (C8, C18) - aqueous mobile phase
- Ion-exchange - aqueous mobile phase
- Molecular sieve - aqueous mobile phase
- Detector
- Specific
- Absorbance
- Fluorescence
- Mass Spectrometry
- Electrochemical
- Non-specific
- Refractive index
- Radioactivity
- Conductivity
- Recorder
 Fig 23.5.1 Diagram illustrating a Typical HPLC System
Redrawn from: Pieper and Rutledge, Laboratory Techniques for Pharmacists, Upjohn 1989, page 27, figure 6
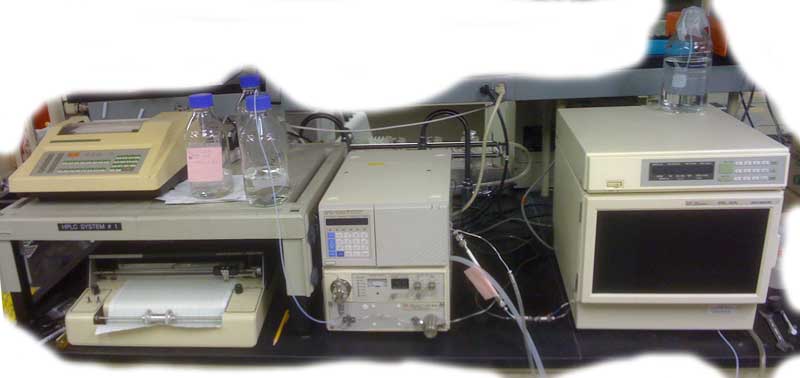
Figure 23.5.2 A HPLC system in the lab
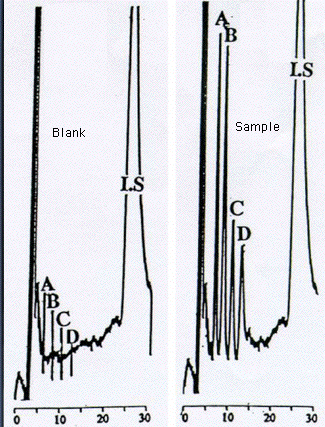
Figure 23.5.3 Example Chromatogram
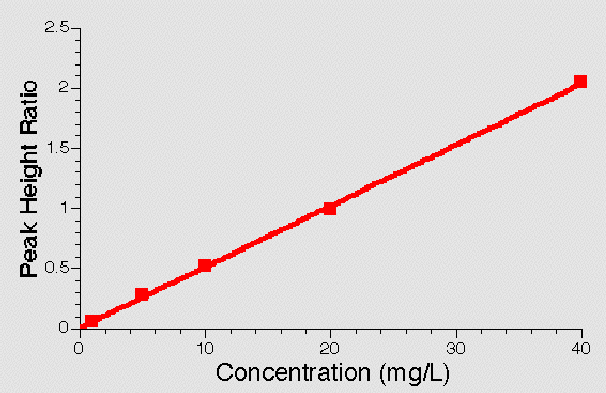
Figure 23.5.4 Example Standard Curve - Peak Height Ratio versus Concentration
return to the Course index
This page was last modified: Sunday, 28th Jul 2024 at 5:06 pm
Privacy Statement - 25 May 2018
Material on this website should be used for Educational or Self-Study Purposes Only
Copyright © 2001 - 2026 David W. A. Bourne (david@boomer.org)
 | Pharmacy Math Part One
A selection of Pharmacy Math Problems |
 |