return to the Course index
previous | next
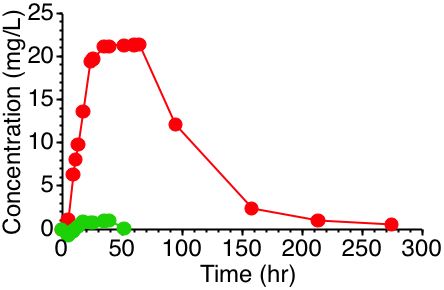
redrawn from Barr, 1969
Figure 3.25.1 Slide showing extra absorption of salicylamide at higher doses. The green dots represent results after a 1 g dose and the red dots represent results after a 2 g dose. The original figure presented results after 0.3 and 0.5 g doses with resulting concentrations below those determined after the 1 g dose. Normally the amount of drug present in the body is no more than the enzymes can handle easily. Metabolism then proceeds in apparent first order fashion. However for some drugs the enzymes can not keep up. Illustrated here is one example, saturation of first pass metabolism allowing more or a higher fraction of drug to be absorbed.
Material on this website should be used for Educational or Self-Study Purposes Only
Copyright © 2001 - 2026 David W. A. Bourne (david@boomer.org)
 | A game to aid recognizing drug structures See how many structures you can name before you run out of lives |
|