return to the Course index
previous | next
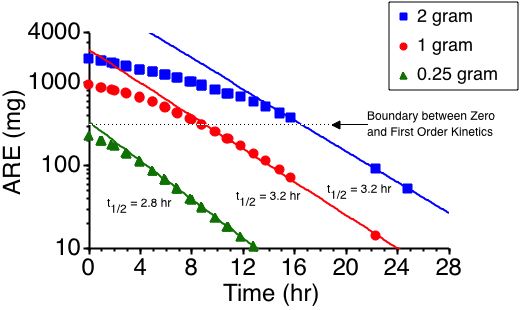
redrawn from Levy, 1965
Figure 3.26.1 Slide of aspirin plasma concentration as a function of time after 0.25, 1 or 2g. At higher doses the metabolism of aspirin is reduced by saturation. The elimination rate constant (as represented by the slope) is reduced.
Material on this website should be used for Educational or Self-Study Purposes Only
Copyright © 2001 - 2026 David W. A. Bourne (david@boomer.org)
 | A game to aid recognizing brand versus generic drug names See how many names you can catch before you run out of lives |
|