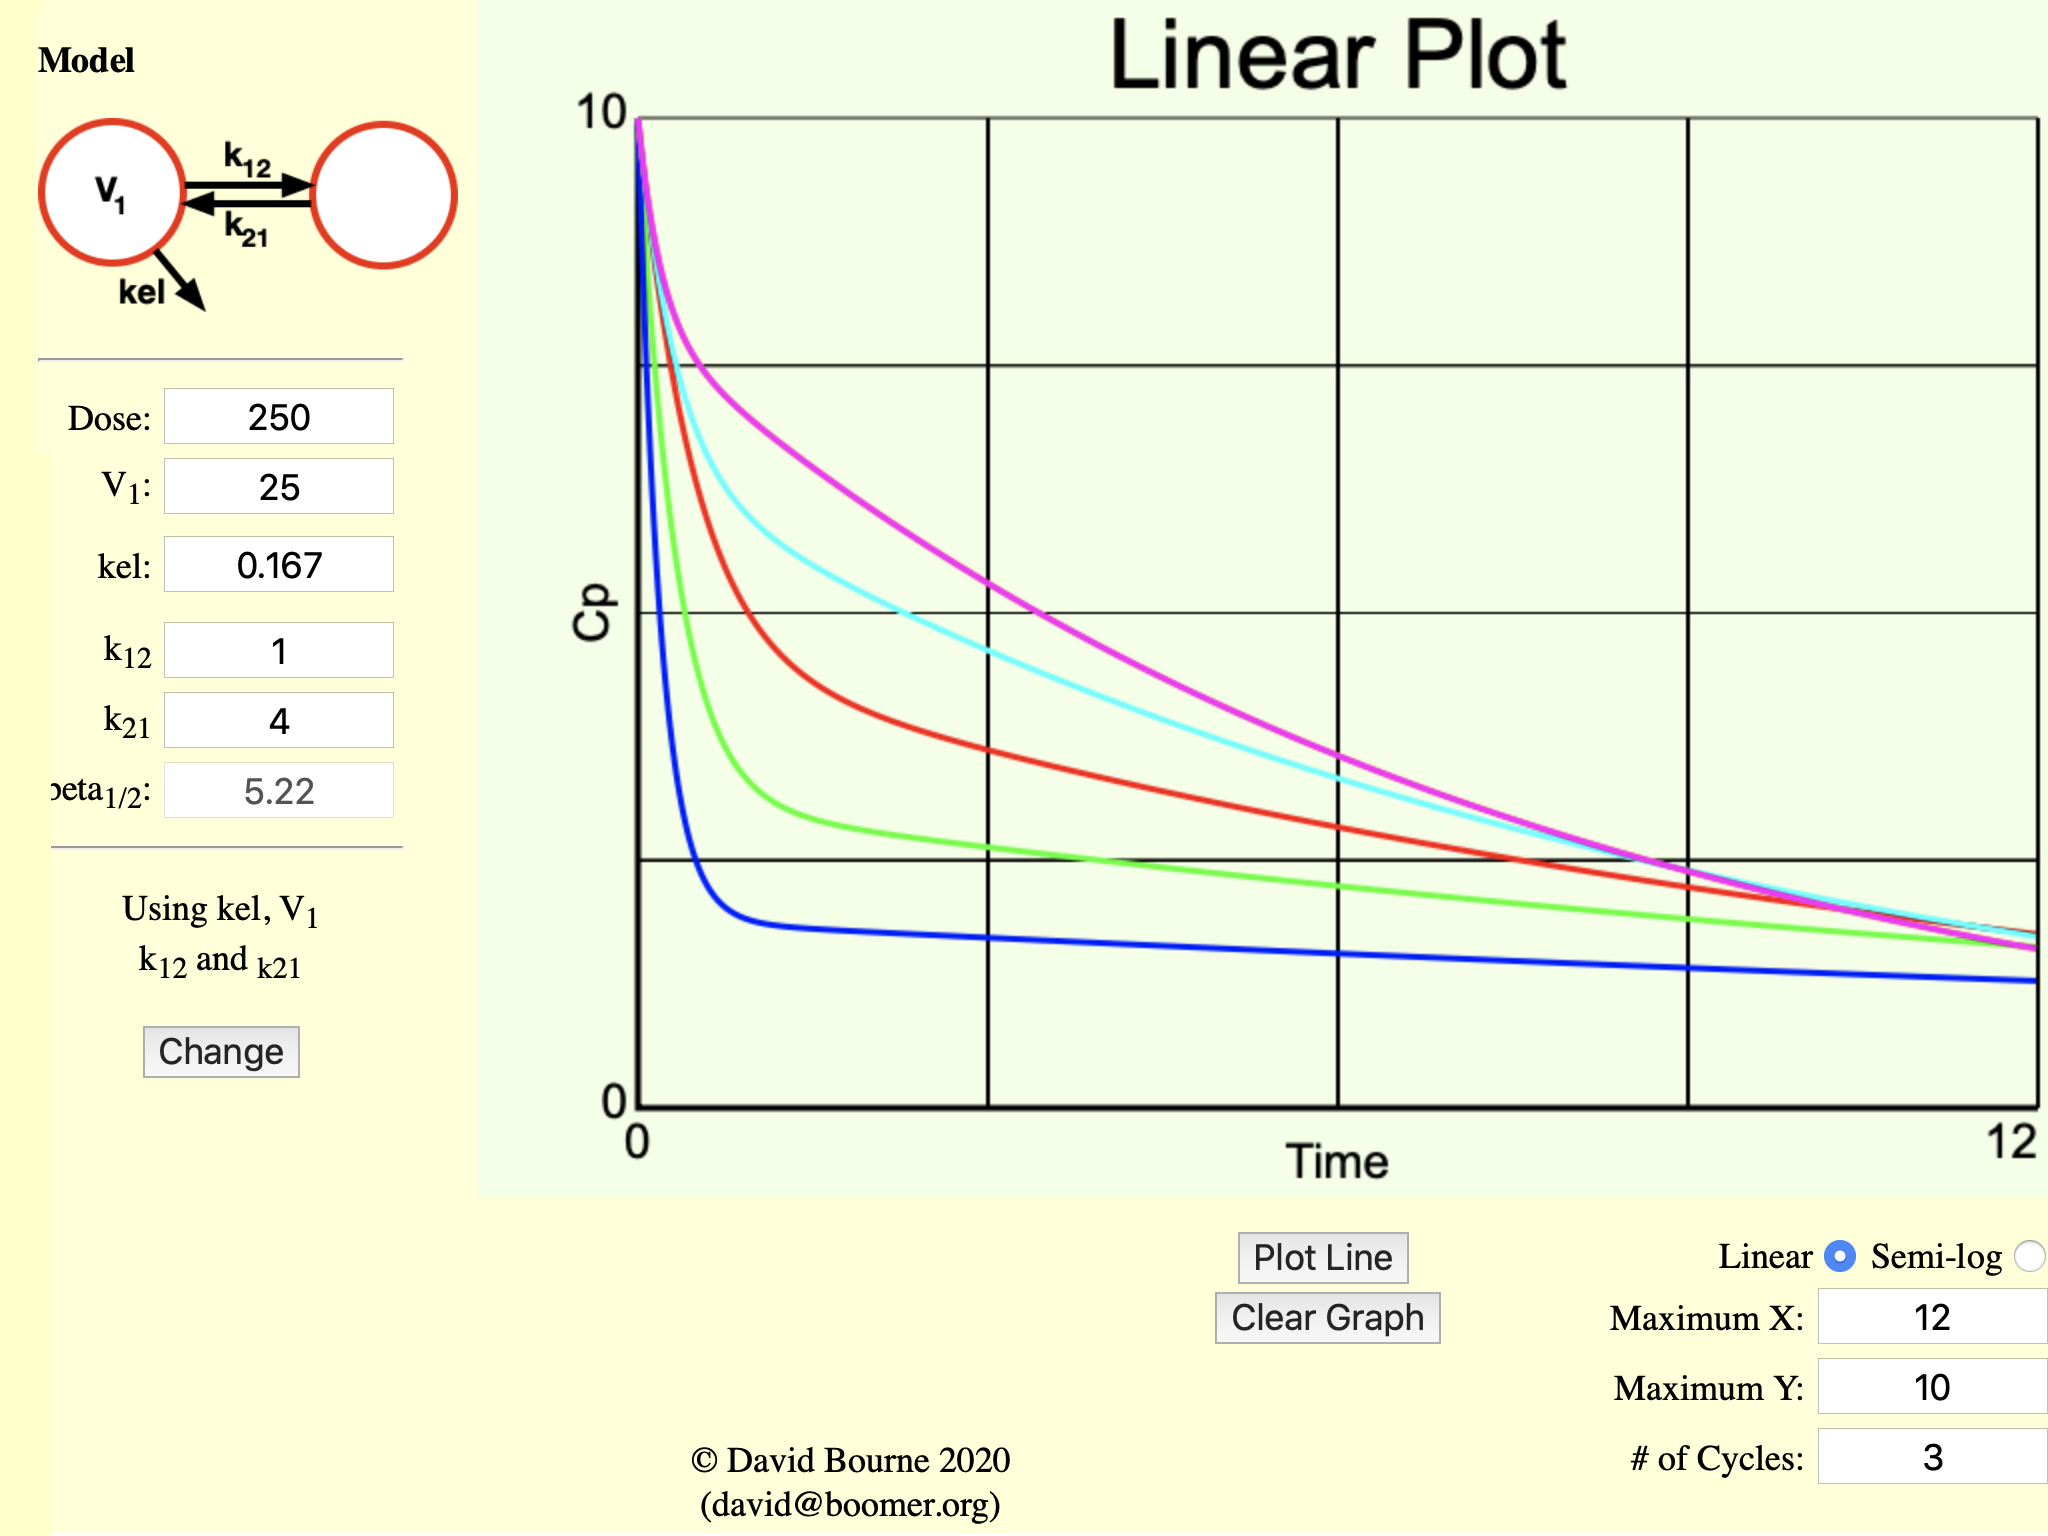
Figure 19.4.1 Plot of Cp versus Time Showing the Effect of Different k12/21 Ratio Values
k12/k21 ratio from 4/1 to 1/4
return to the Course index
previous | next
Figure 19.4.1 Plot of Cp versus Time Showing the Effect of Different k12/21 Ratio Values
k12/k21 ratio from 4/1 to 1/4
Click on the figure to view the interactive graph
From the k12 and k21 values we can assess the extent of distribution of drug into the peripheral compartment. The higher the ratio k12/k21 the greater the distribution of drug into the peripheral compartment. The larger the individual values of k12 and k21 the faster is the transfer between the central and peripheral compartments and the more the body behaves as a single compartment.
As the ratio increases the distribution phase is more pronounced. Conversely with the ratio 1/4 there is very little distribution phase. Also note that the β value or the slope of the terminal phase is changing even though the kel is fixed at 0.167 hr-1.
With faster and faster distribution the initial drop in plasma concentration becomes quite rapid. If you were sampling every 30 minutes, the initial phase would be missed. The data would look just like a one compartment model. Redrawing the slow plot with k12/k21 (0.5/0.25) over 24 hours and gives a plot that is definitely still biexponential.
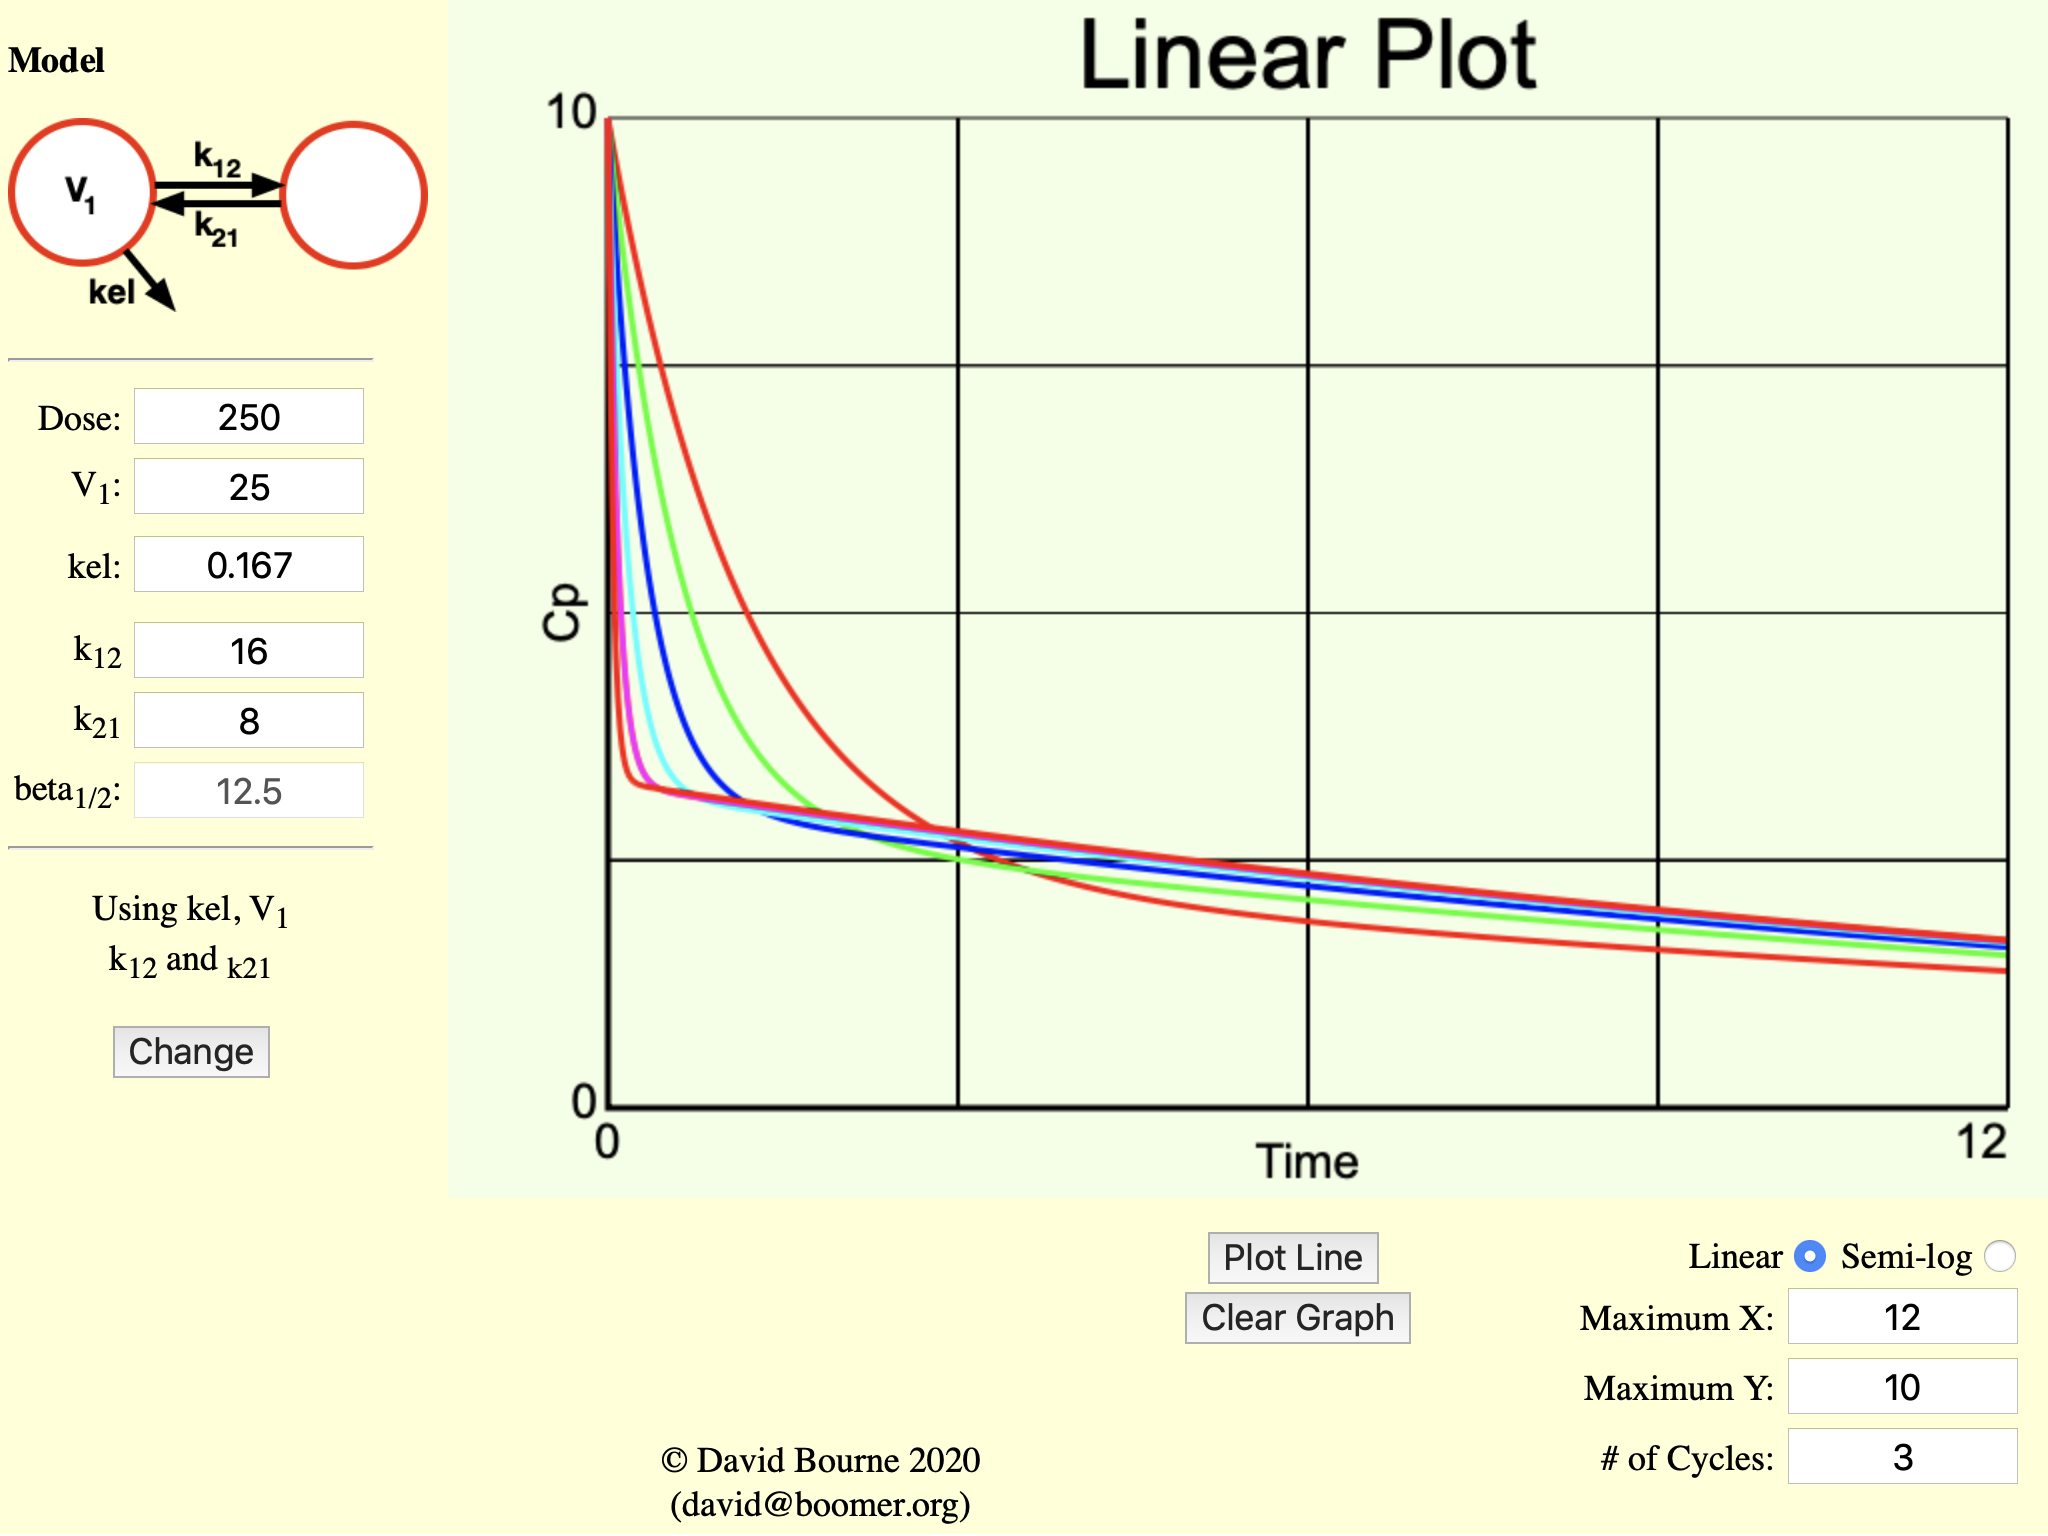
Figure 19.4.2 Plot of Cp versus Time Showing the Effect of Different k12/21 Magnitudes
k12/k21 magnitude from 0.5/0.5 to 16/8
Click on the figure to view the interactive graph
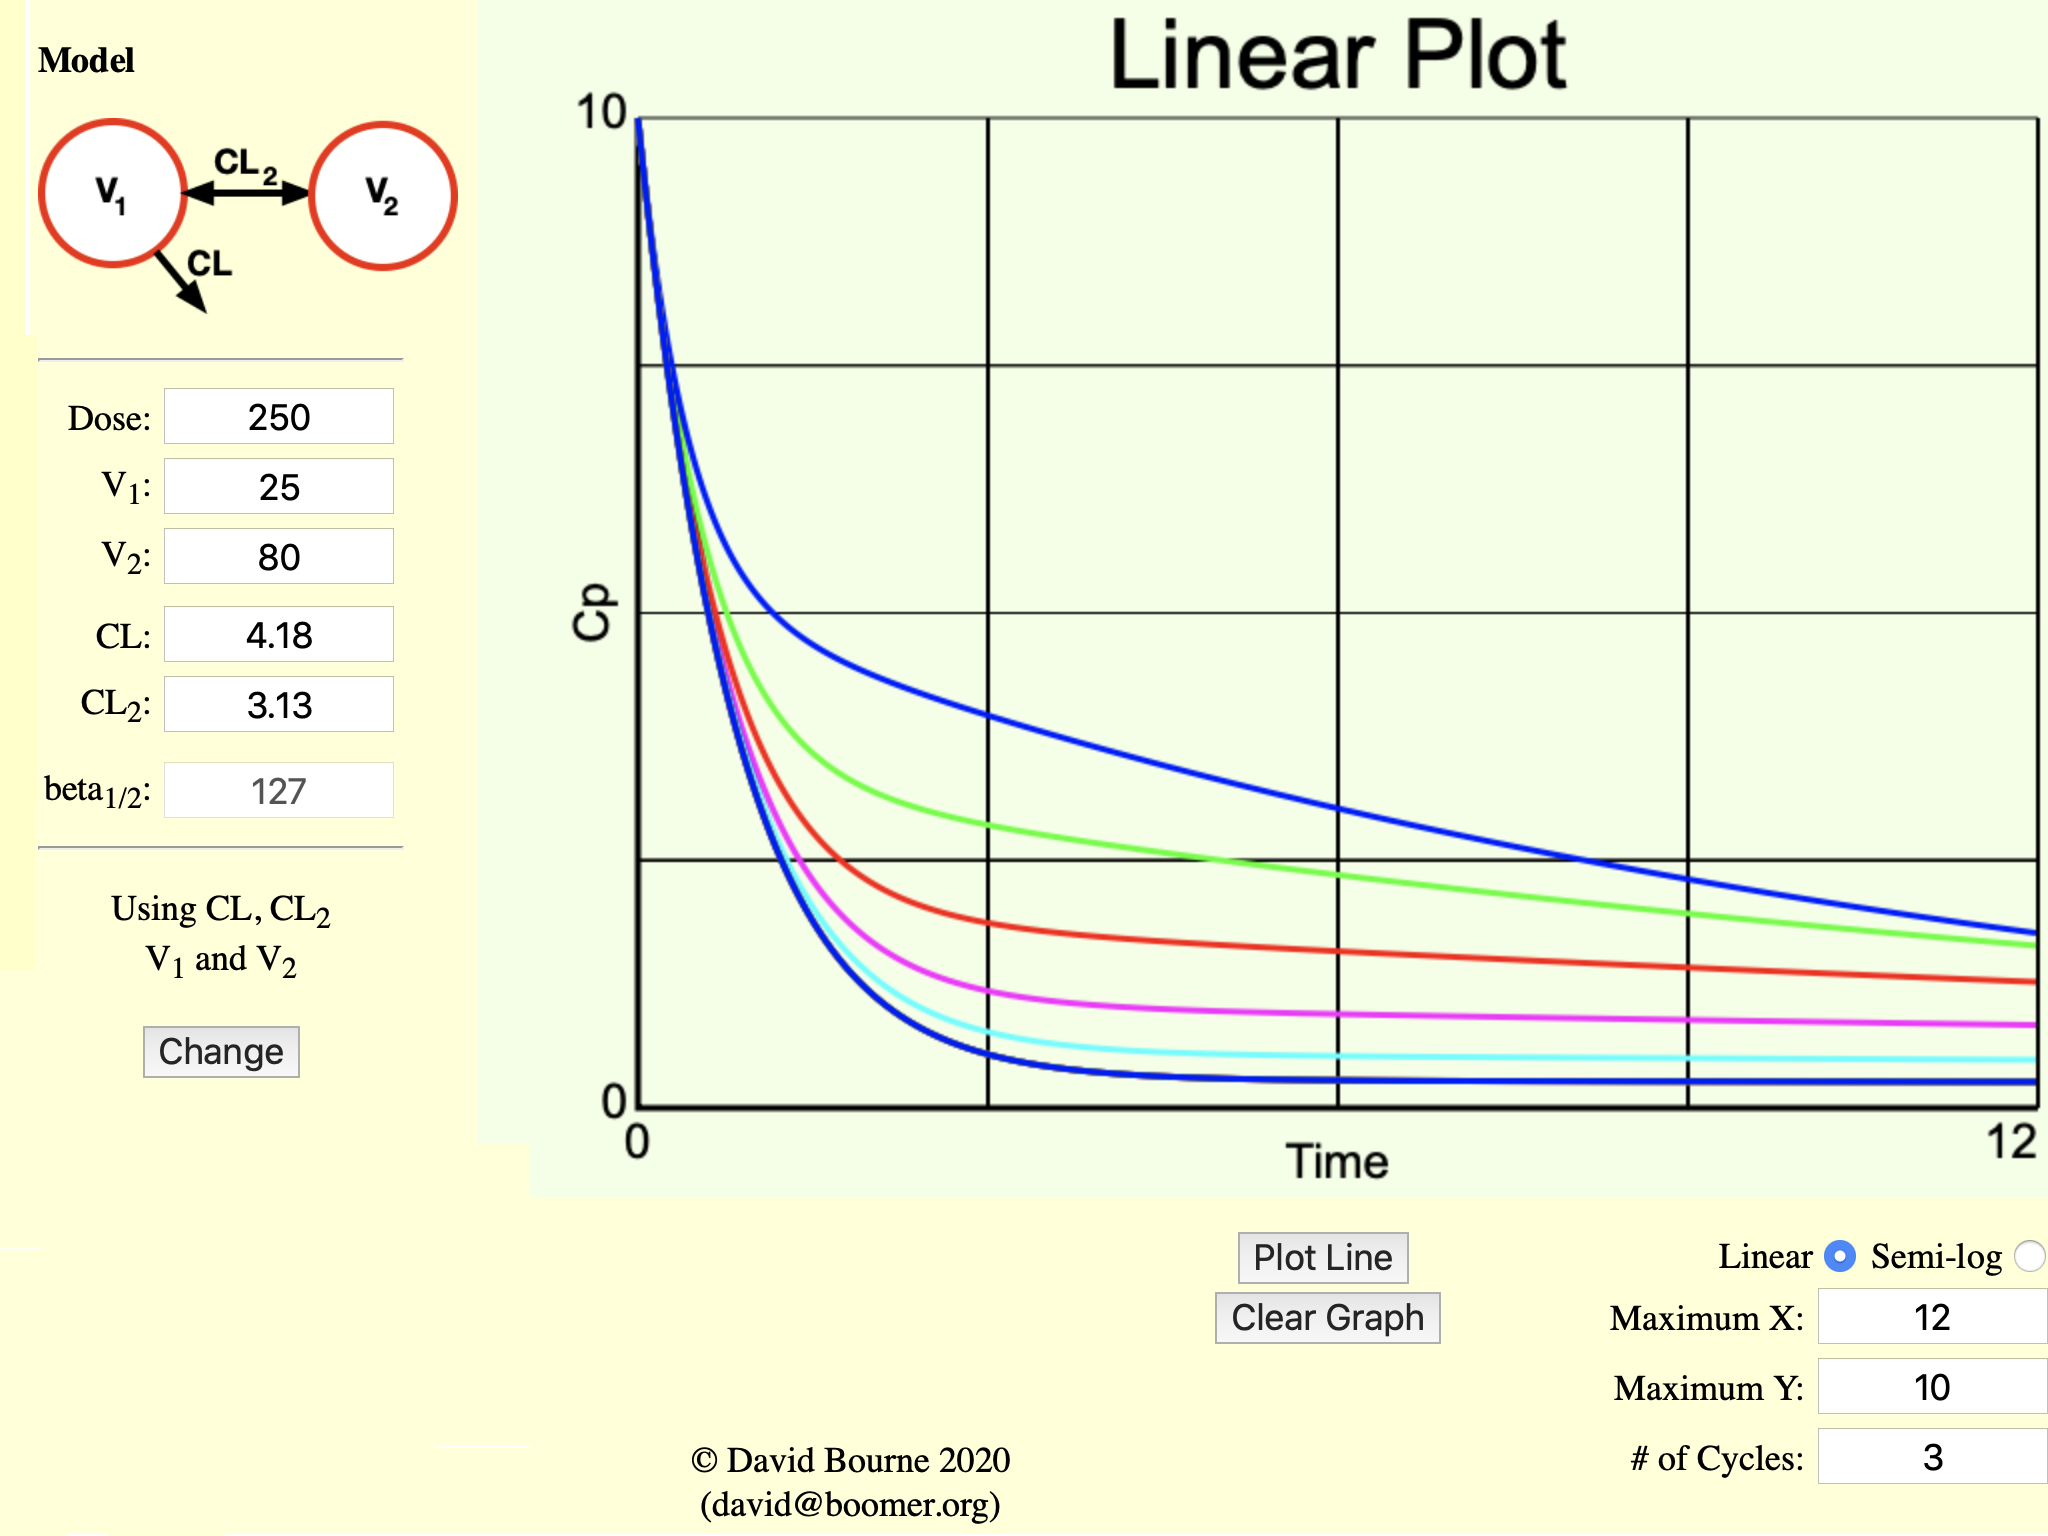
Figure 19.4.1 Plot of Cp versus Time Showing the Effect of Different V2 values
V2 from 2.5 to 80 L
Click on the figure to view the interactive graph
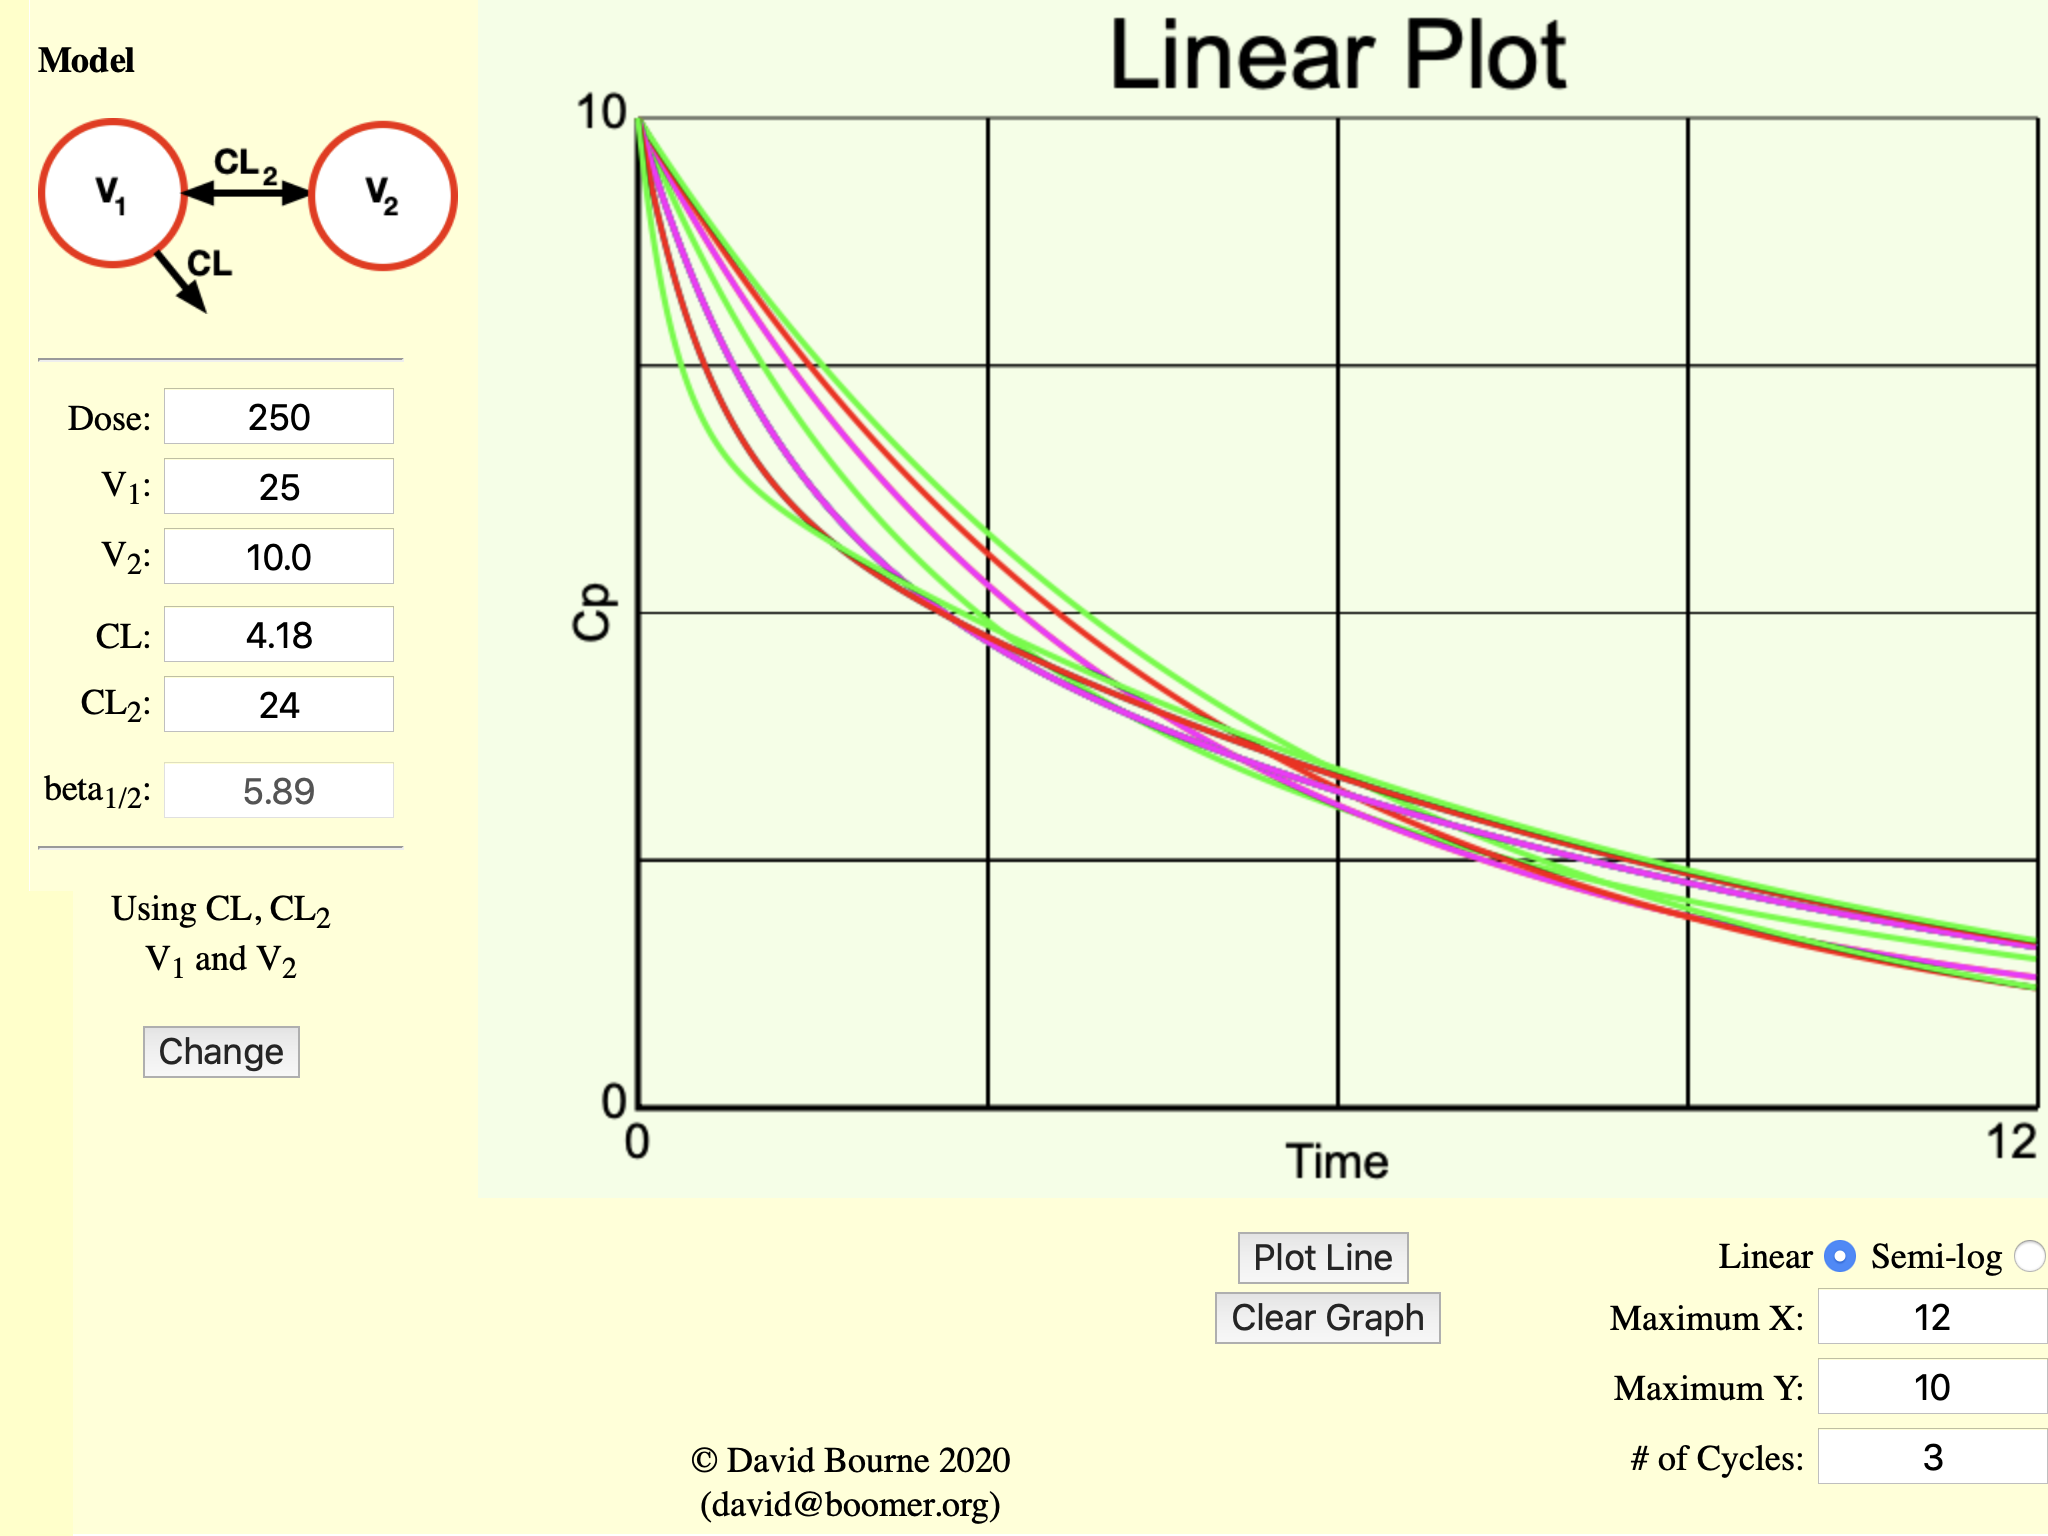
Figure 19.4.1 Plot of Cp versus Time Showing the Effect of Different CL2 values
CL2 from 0.375 to 24 L/hr.
Click on the figure to view the interactive graph
macro constants (A, B, α and β) Interactive plot
or micro constants (kel, k12, k21, and V1) Interactive plot
Material on this website should be used for Educational or Self-Study Purposes Only
Copyright © 2001 - 2026 David W. A. Bourne (david@boomer.org)
 | Pharmacy Math Part Two A selection of Pharmacy Math Problems |
 |