Equation 19.6.1 Equation for Loading Dose
return to the Course index
previous | next
Equation 19.6.1 Equation for Loading Dose
To achieve an initial Cp of 20 mg/L given V1 = 30 liter would require a DOSE = 20 * 30 = 600 mg.
Alternately if a dose of 500 mg is given and the V1 value is 16 L, the expected Cp0 can be calculated.
Cp0 = 500/16 = 31.3 mg/L
If the A, B, α, and β values are known or calculated, then the plasma concentration at any time after a single IV dose can be calculated.
The plasma concentration achieved after a continuous IV infusion is given by the same equation described for the one compartment model, i.e.:
Equation 19.6.2 Equation for Maintenance Infusion Rate
If a plasma concentration of 30 mg/L is required and V1 = 15 L and kel is 0.2 hr-1 then the required infusion rate can be readily determined.
k0 = 30 x 15 x 0.2 = 90 mg/hr
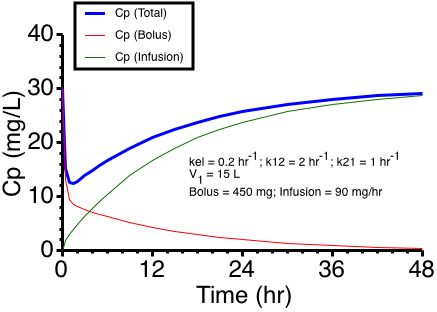
Figure 19.6.1 Linear Plot of Cp Versus Time With IV Bolus and Infusion
Click on the figure to view as an interactive graph
Since the time to reach the steady state concentration is controlled by the β value this could mean a slow approach to the desired value, thus an IV bolus loading dose may be useful. Unfortunately this calculation is not straight forward as you will see if you explore the interactive graph.
With V1 = 15 L, kel = 0.2 hr-1, and required Cp = 30 mg/L
Bolus DOSE = 15 x 30 = 450 mg and
Infusion Rate = k0 = 30 x 15 x 0.2 = 90 mg/hr
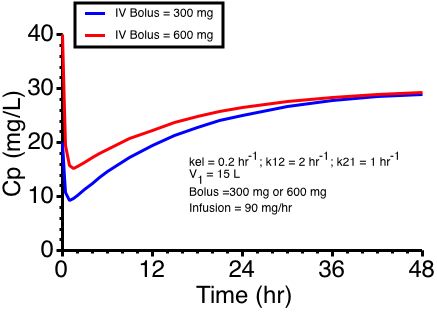
Figure 19.6.2 Linear Plot after an IV Infusion and a Higher or Lower Bolus Dose
As you can see (Figure 19.6.1 and 19.6.2 above) this gives quite a dip in the Cp versus time curve.
With Bolus DOSEs, either 600 or 300 mg (shown in Figure 19.6.2) the curves may or may not be better depending on the therapeutic range of the drug.
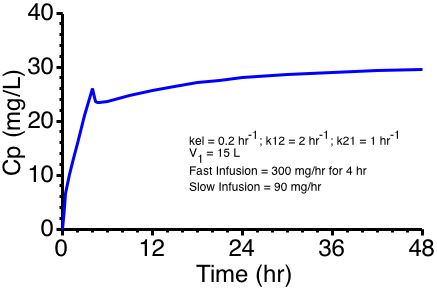
Figure 19.6.3 Linear Plot of Cp versus Time With Fast and Slow Infusion
Click on the figure to view as an interactive graph
Another approach is to give a fast infusion followed by the slower, maintenance infusion. Here 1200 mg was given over 4 hours (at 300 mg/hr) before switching to the slower 90 mg/hr maintenance rate. Calculations derived in part from Ritschel and Kearns, 2004.
Material on this website should be used for Educational or Self-Study Purposes Only
Copyright © 2001 - 2026 David W. A. Bourne (david@boomer.org)
 | Pharmacy Math Part One A selection of Pharmacy Math Problems |
 |