Figure 11.3.1 Plot of WSS versus kel and V
return to the Course index
previous | next
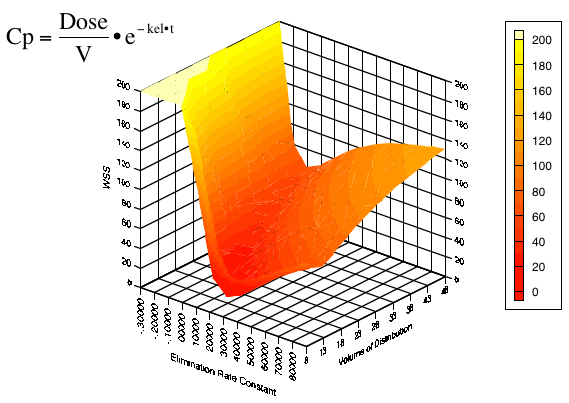
Note that the WSS is a function of the observed data, x value (time), data weight, constants from the model, and adjustable parameters. For a model with two parameters such as a one compartment model after an IV bolus dose the WSS surface can be represented by a three dimensional surface.
Figure 11.3.1 Plot of WSS versus kel and V
The objective of nonlinear regression analysis is to move from an initial estimate of the parameters to a global minimum value. When can see the WSS surface it is easy to move to the minimum by inspection, however, this ignores the calculations needed to construct the image of the WSS surface. The nonlinear regression program will look for this minimum without constructing the whole surface. The program will use the initial value and information around this value to move to a point closer to the minimum, lower WSS value.
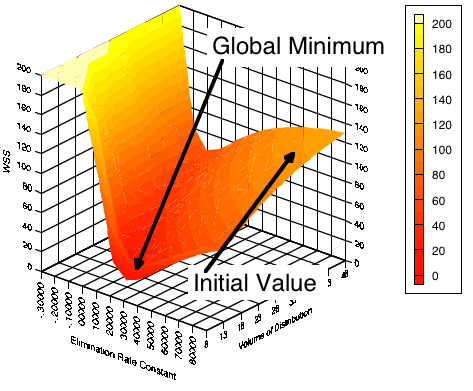
Figure 11.3.2 Plot of WSS versus kel and V illustrating a start and finish point
The computer can use a number of algorithms or methods to reach the finish point.
Material on this website should be used for Educational or Self-Study Purposes Only
Copyright © 2001 - 2026 David W. A. Bourne (david@boomer.org)
 | A game to aid recognizing drug structures See how many structures you can name before you run out of lives |
|