Figure 12.3.1 Dissolution and Absorption
return to the Course index
previous | next

Figure 12.3.1 Dissolution and Absorption
If absorption is slow relative to dissolution then all we are concerned with is absorption. However, if dissolution is the slow, rate determining step (the step controlling the overall rate) then factors affecting dissolution will control the overall process. This is a more common problem with drugs which have a low solubility (below 1 g/100 ml) or which are given at a high dose, e.g. griseofulvin.
There are a number of factors which affect drug dissolution. One model that is commonly used is to consider this process to be diffusion controlled through a stagnant layer surrounding each solid particle.

Figure 12.3.2 Diagram Representing Diffusion Through the Stagnant Layer
A physical model is shown in Figure 12.3.2
First we need to consider that each particle of drug formulation is surrounded by a stagnant layer of solution.
After an initial period we will have a steady state where drug is steadily dissolved at the solid-liquid interface and diffuses through the stagnant layer. If diffusion is the rate determining step we can use Fick's first law of diffusion to describe the overall process.

Figure 12.3.3 Plot of Concentration Gradient
If we could measure drug concentration at various distances from the surface of the solid we would see that a concentration gradient is developed. If we assume steady state we can used Fick's first law to describe drug dissolution.

Equation 12.3.1 Fick's first Law of Diffusion applied to Dissolution
where D is the diffusion coefficient, A the surface area, Cs the solubility of the drug, Cb the concentration of drug in the bulk solution, and h the thickness of the stagnant layer. If Cb is much smaller than Cs then we have so-called "Sink Conditions" and the equation reduces to

Equation 12.3.2 Fick's First Law - Sink Conditions
with each term in this equation contributing to the dissolution process.

Figure 12.3.4 Reducing Particle Size Increases Surface Area
Methods of particle size reduction include mortar and pestle, mechanical grinders, fluid energy mills, solid dispersions in readily soluble materials (PEG's).

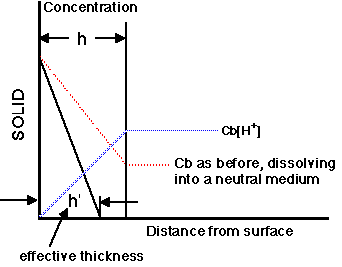
Figure 12.3.5 Plot of Concentration versus Distance for Dissolution into a Reactive Medium
The apparent thickness of the stagnant layer can be reduced when the drug dissolves into a reactive medium. For example, with a weakly basic drug in an acidic medium, the drug will react (ionize) with the diffusing proton (H+) and this will result in an effective decrease in the thickness of the stagnant layer.
The effective thickness is now h' not h. Also the bulk concentration of the drug is effectively zero. For this reason weak bases will dissolve more quickly in the stomach.

Figure 12.3.6 Dissolution profiles for three salts and acid penicillin V, pH 4
Redrawn from Juncher and Raaschou, 1957
Salts of weak acids and weak bases generally have much higher aqueous solubility than the free acid or base, therefore if the drug can be given as a salt the solubility can be increased and we should have improved dissolution. One example is Penicillin V.

Figure 12.3.7 Plasma concentration after oral administration to fasted patients
Redrawn from Juncher and Raaschou, 1957
This can lead to quite different Cp versus time results after oral administration.
The tpeak values are similar thus ka is probably the same. Cpeak might show a good correlation with solubility. Maybe site limited (only drug in solution by the time the drug gets to the 'window' is absorbed). Use the potassium salt for better absorption orally. These results might support the use of the benzathine or procaine salts for IM depot use.

Figure 12.3.8 Plot of Cp versus Time for Five Formulations of Chloramphenicol Palmitate
Redrawn from Aguiar et al. 1967
Some drugs exist in a number of crystal forms or polymorphs. These different forms may well have different solubility properties and thus different dissolution characteristics. Chloramphenicol palmitate is one example which exists in at least two polymorphs. The B form is apparently more bioavailable.
The recommendation might be that manufacturers should use polymorph B for maximum solubility and absorption. However, a method of controlling and determining crystal form would be necessary in the quality control process. Shelf-life could be a problem as the more soluble (less stable) form may transform into the less soluble form. In time the suspension may be much less soluble with variable absorption.
A drug was administered as an IV injection, and oral solution and two tablet formulations (one rapid and the other a slow release tablet). A dissolution step was included to model the two tablet formulations. Parameters values included kel = 0.077 hr-1,V = 81.3 L, ka = 0.113 hr-1. The two tablet formulations required kd = 0.405 hr-1 or 0.0261 hr-1. The dose were 25000 mg (Dose1 IV bolus), 20300 mg (Dose2 Oral solution), 19000 mg (Dose3 Oral rapid release tablet) and 21600 mg (Dose3 Oral slow release tablet). Simulate the concentration versus time curves after each dose. Bevill et al., 1977. Explore the problem as a Linear Plot - Interactive graph
return to the Course index
previous | next
Material on this website should be used for Educational or Self-Study Purposes Only
Copyright © 2001 - 2026 David W. A. Bourne (david@boomer.org)
 | A tvOS app which presents a collection of video tutorials related to Basic Pharmacokinetics and Pharmacy Math |
|